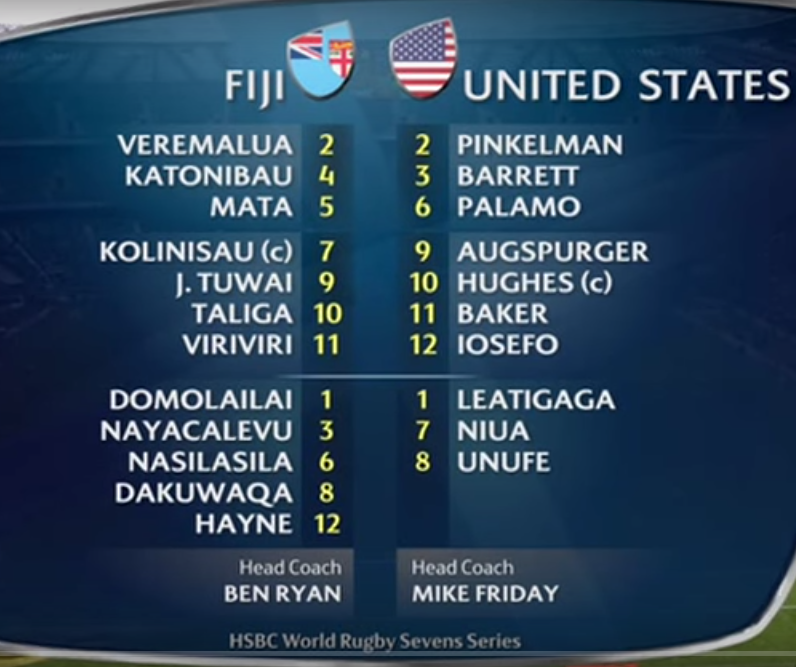
Why this game?
This was the USA’s lone win against Fiji during the 2015-2016 circuit as Fiji went 4-1 with wins by 10, 9, 7 and 5. Pool mates in Rio, I’m curious what to expect when they match up on August 10th.
Narrative
As the third-place match in London, this was the last game of the season for both teams. The Americans dropped a disappointing semi-final to Scotland after thrashing New Zealand in the quarters. Fiji clinched the series in their quarter-final win over France before losing to South Africa by 5 in their semi-final. Fiji seemingly had little motivation for the game and confirmed this by turning over the first three kickoffs.
Analysis
Through most of this analysis I will be talking about expected points. This is calculated through recording game events and taking the average points scored from similar situations. Since this is the average across all games (not just games with the USA and Fiji), we’ll see how much better or worse the USA and Fiji performed in comparison to the average team, not what we would expect the USA and Fiji to do against each other.
I owe readers a more thorough explanation but for now, you’ll have to get acquainted to the idea through these game analyses or my opening statement.

| Fiji opportunity #1 | |||||
|---|---|---|---|---|---|
| Start Loc. | Source | Exp. Pts. | End Loc. | Reason | Act. Pts. |
| 30 | Restart | 1.0 | 30 | Loose ball | 0 |
| USA opportunity #1 | |||||
|---|---|---|---|---|---|
| Start Loc. | Source | Exp. Pts. | End Loc. | Reason | Act. Pts. |
| 70 | Intercept | 4.1 | 100 | Try | 7 |
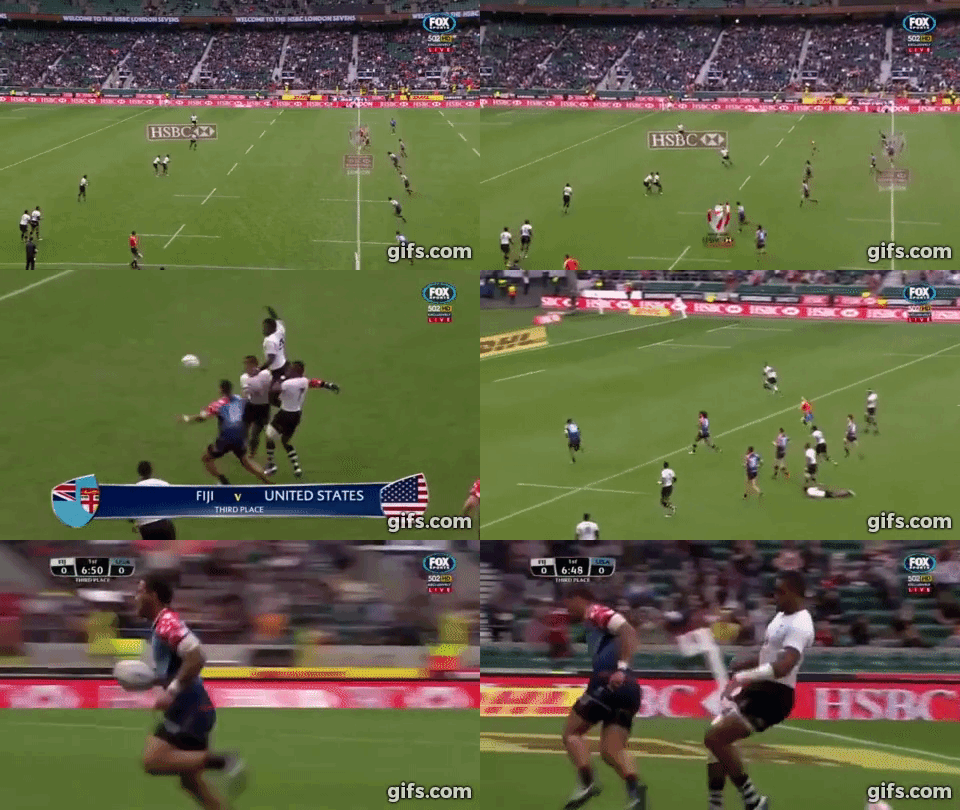
As a result of alignment and execution issues on the opening kickoff, Fiji gifted the United Stats an early 7 points. Taliga lets Jerry Tuwai back up into his space just enough to flick the ball into Iosefo’s hands for a try with 11 seconds gone. The shallow alignment for Fiji left no man back for a last chance tackle. My numbers suggest the play was a 5 point swing, but considering the ease with which Iosefo scored, it may be worth even more.
| Fiji opportunity #2 | |||||
|---|---|---|---|---|---|
| Start Loc. | Source | Exp. Pts. | End Loc. | Reason | Act. Pts. |
| 23 | Restart | 0.8 | 77 | Loose ball | 0 |
| USA opportunity #2 | |||||
|---|---|---|---|---|---|
| Start Loc. | Source | Exp. Pts. | End Loc. | Reason | Act. Pts. |
| 77 | Turnover | 3.6 | 77 | Pen | 0 |
| 77 | Pen | 3.2 | 100 | Try | 7 |
The second kickoff was nearly identical, as Barrett scooped up a loose ball that went just over a lifted receiver. Barrett wasn’t away free though and was thumped into touch with a high tackle. Fiji’s inability to gather the kickoff and high tackle essentially gave the USA 4 points. The following penalty move created no gaps for the Americans but Pinkleman brushed off three Fijians anyway to put the USA up 14-0 having done nothing much besides accept Fiji’s graces. Considering the USA had to kick back to Fiji, the broken tackles hurt Fiji by about 2.7 points.
| Fiji opportunity #3 | |||||
|---|---|---|---|---|---|
| Start Loc. | Source | Exp. Pts. | End Loc. | Reason | Act. Pts. |
| 35 | Restart | 1.1 | 35 | Knock-on | 0 |
| USA opportunity #3 | |||||
|---|---|---|---|---|---|
| Start Loc. | Source | Exp. Pts. | End Loc. | Reason | Act. Pts. |
| 65 | Scrum | 3.1 | 60 | Knock-on | 0 |
| Fiji opportunity #4 | |||||
|---|---|---|---|---|---|
| Start Loc. | Source | Exp. Pts. | End Loc. | Reason | Act. Pts. |
| 40 | Turnover | 2.2 | 100 | Try | 7 |
An exchange of knock-ons gave Fiji their first chance with the ball and their potency was on display. Katonibau created a 4 on 2 with half the field’s width by stepping Augspurger. One slip and Fiji scored on a clean break from 55 out to cut the deficit in half. Their score from this position was 3.7 points better than your average team’s possession in the same spot. Fiji went on to gain 194 meters on only 4 open play possessions compared to 202m for the USA on 8 possessions in hand. Of their possible available meters, Fiji gained 80% compared to the USA’s 56%.
| USA opportunity #4 | |||||
|---|---|---|---|---|---|
| Start Loc. | Source | Exp. Pts. | End Loc. | Reason | Act. Pts. |
| 33 | Restart | 1.1 | 33 | Fiji knock-on | 0 |
| 33 | Lineout | 1.2 | 100 | Try | 5 |
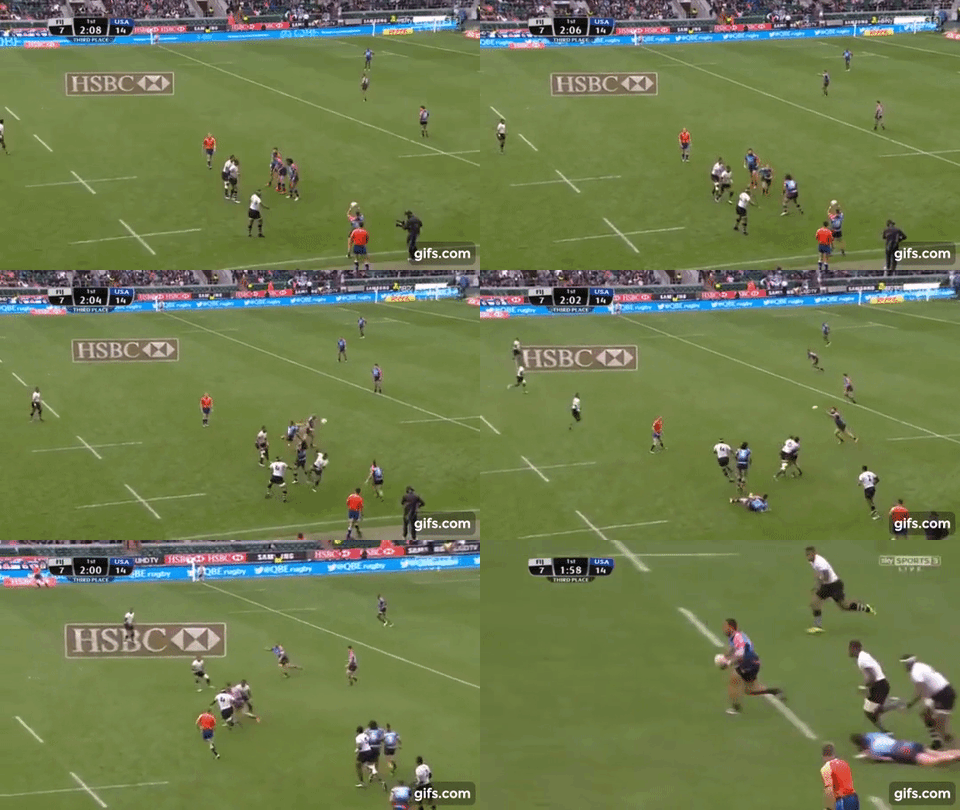
Though Fiji helped the USA score their first two tries, this possession showed the American’s ability to create their own offense from a non-threatening position in front of a well-formed defensive line.

After the restart bounced out, the USA went to their most popular lineout; a front single lift while the would-be back lifter drops into the line. I’m not sure what to call the line Iosefo runs, but without his vision to cut off his unders line, Barrett’s half-break would be for naught. A bit of work was required to finish but they eventually sprang Baker to the corner after one ruck. The teamwork was tremendous and the USA deserved the try. Everyone contributed while Barrett’s playmaking stood out.
| Fiji opportunity #5 | |||||
|---|---|---|---|---|---|
| Start Loc. | Source | Exp. Pts. | End Loc. | Reason | Act. Pts. |
| 35 | Restart | 1.1 | 100 | Try | 7 |
The USA pressured the kickoff but missed, providing Fiji another of their 4 breaks in the game. (Averaging a break per possession is one sign of a healthy offense.) The USA hung on well but were pushed back to their try line. Veremalua, laying on the ground from a Barrett tackle, dummies to Katonibau running a tight line then throws a 10 meter pass to Taliga for the score. All from the ground. Many of the American players were shocked there was no whistle for Veremalua not playing the ball immediately and coach Mike Friday mentioned it in his post-match interview. Considering the Americans’ recovery after overcommitting at the kickoff, and the dubious offload, it was impressive defense. Since this was the last play of the half and Fiji didn’t have to kick back to the Americans, Fiji created almost 6 extra points on their own.
| USA opportunity #5 | |||||
|---|---|---|---|---|---|
| Start Loc. | Source | Exp. Pts. | End Loc. | Reason | Act. Pts. |
| 35 | Restart | 1.1 | 60 | Penalty | 0 |
| Fiji opportunity #6 | |||||
|---|---|---|---|---|---|
| Start Loc. | Source | Exp. Pts. | End Loc. | Reason | Act. Pts. |
| 40 | Penalty | 1.9 | 100 | Try | 5 |
Fiji tied the game in the second half and had plenty of time to make good on recovering from early errors. Their score started with a break from another offload off the ground. Fiji fulfilled their reputation as daring offloaders in this game, passing 5 times from the ground from 9 tackles. But they sent the resulting kickoff out of bounds, providing a solid platform for some Madison Hughes magic.
| USA opportunity #6 | |||||
|---|---|---|---|---|---|
| Start Loc. | Source | Exp. Pts. | End Loc. | Reason | Act. Pts. |
| 50 | Free kick | 2.3 | 100 | Try | 7 |

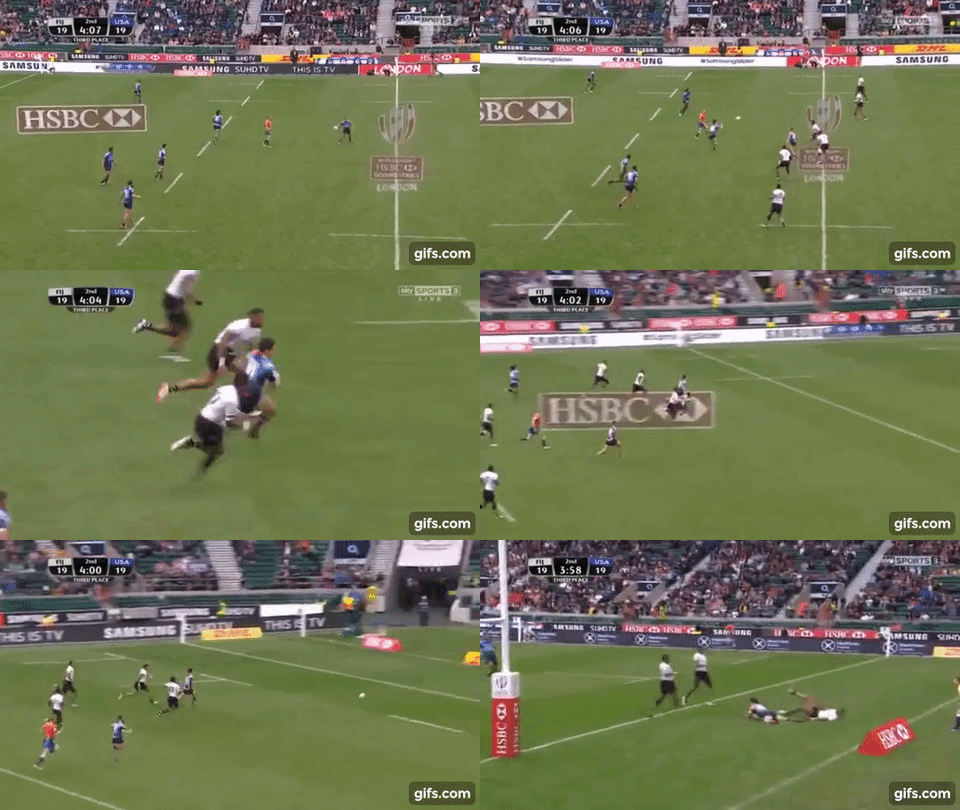
This fantastic individual effort is another example of the USA earning their victory. Hughes essentially turned a situation worth 2.3 points into an immediate 7 points. The conversion was no trivial matter but Hughes nailed it, providing the United States with a full 7 point cushion.
| Fiji opportunity #7 | |||||
|---|---|---|---|---|---|
| Start Loc. | Source | Exp. Pts. | End Loc. | Reason | Act. Pts. |
| 35 | Restart | 1.1 | 35 | USA knock-on | 0 |
| 35 | Scrum | 2.0 | 35 | Loose ball | 0 |
| USA opportunity #7 | |||||
|---|---|---|---|---|---|
| Start Loc. | Source | Exp. Pts. | End Loc. | Reason | Act. Pts. |
| 65 | Turnover | 1.5 | 60 | Knock-on | 0 |
The USA knocked the kickoff on but stole the following scrum. However, an uncharacteristic immediate knock-on by Hughes gave Fiji another chance through a scrum.
| Fiji opportunity #8 | |||||
|---|---|---|---|---|---|
| Start Loc. | Source | Exp. Pts. | End Loc. | Reason | Act. Pts. |
| 40 | Scrum | 2.2 | 52 | Tackle turnover | 0 |
| USA opportunity #8 | |||||
|---|---|---|---|---|---|
| Start Loc. | Source | Exp. Pts. | End Loc. | Reason | Act. Pts. |
| 50 | Turnover | 2.6 | 63 | Penalty | 0 |
| 63 | Penalty | 2.7 | 78 | Lineout | 0 |
| 78 | Lineout | 2.8 | 80 | Knock-on | 0 |
Having scored 3 tries on their first 3 possessions in hand, Fiji needed 1 more converted score to tie the game. Jarryd Hayne came on for a hard run and half-break. Fiji create another half-break, their last of 4, before Hughes poached. (Recording even a single half-break per possession is going to score you plenty of points.) Though Hughes’s poach was worth almost 5 expected points, it was most important to the game result as Fiji never touched the ball again. The USA earned a penalty, kicked to touch, won the lineout, and worked off the last 1:15 of the clock to survive with a 7 point victory.
| Summary Statistics | ||
|---|---|---|
| USA | Fiji | |
| Possessions in Hand | 8 | 4 |
| Expected Points Based on Starting Positions/Sources | 19.4 | 11.4 |
| Expected Points Sequence | 7.1 | -7.1 |
| Kickoff Points Added | 0.4 | -1.2 |
| Kickoff Reception Points Added | 0.5 | -12.4 |
| Scrum and Lineout Points Added | 0.4 | -3.3 |
| Open Play Points Added | 5.8 | 11 |
| Conversion Points Added | 0.3 | 0 |
| Line Breaks | 4 (+1 turnover break) | 4 |
| Half Breaks | 1 | 4 |
| Meters Gained / Possible in Hand | 202 / 358 = 59% | 195 / 245 = 80% |
Conclusion
As mentioned above, the numbers listed will require additional explanation beyond this post. But in brief, I’ve broken the events into isolated segments of the game — kickoff, kickoff reception, scrum and lineout, open play, and conversion kicking — to compare how well the teams did in those areas against expected outcomes. Additionally, I’ve provided an overall expected points calculation based on starting location and source. The expected numbers in this category are lower than the actual game score, showing that either the offenses performed well or the defenses performed poorly. The Expected Points Sequence calculation is a complete back and forth of expected points through all events where one team’s gain is equal to the other team’s loss. Predictably, the winning team finished positive though that isn’t always true.
With the ball, Fiji struck at the USA and found their support with excellent, albeit questionably delayed offloads from the deck. They added 11 points above average on only 4 possessions in hand. If Fiji could have secured more possessions, we would have expected them to win.
Outside of Fiji’s performance with the ball, they were below average. Not just below average for Fiji’s standards but below the average for all World Series teams. I wouldn’t expect this in many future games. Their lack of kickoff control was disastrous and simply didn’t provide them enough possessions to win. Furthermore, they gave great opportunities to the USA, contributing to an early 14-0 deficit. The USA deserves some credit but didn’t face the best Fiji could offer.
The USA should be proud of any victory over the best team in the world, especially when scoring on 4 of 8 chances. Barrett’s creation from the lineout and Hughes’s score gave the USA enough points to beat a below average Fiji performance. In the Olympic matchup, the USA will need to defend offloads off the ground better as they likely will not be able to count on such poor play by the Fijians in other facets of the game.