Hong Kong 2017 – Australia v USA Stats

Final Score – Australia 26, USA 19
Referee – Tevita Rokovereni

Possession

Team Games Opps Opp Rate Gathers Gather Rate
Australia 1 8 8.0 7 0.88
USA 1 8 8.0 7 0.88

Scoring

Team Tries Try Rate Con Atmpts Cons Con Rate
Australia 4 0.57 4 3 0.75
USA 3 0.43 3 2 0.67

Offensive Meters

Team Kicking Meters Running Meters Total Meters Max. Possible Meters % of Max Gained
Australia 0 252 252 493 51.1%
USA 13 271 284 554 51.3%

Receiving Kickoffs

Team Kickoffs Opp KO Errors Wins (w/o Errors) Win % (w/o Errors)
Australia 4 0 3 75.0%
USA 4 0 3 75.0%

Kickoffs

Team Kickoffs Errors Wins Win % (w/ Errors)
Australia 4 0 1 25.0
USA 4 0 1 25.0

Defensive Contact

Team Contact Opps D Successes D Success Rate D Failures D Fail Rate
Australia 18 2 11.1% 4 22.2%
USA 30 3 10.0% 10 33.3%

Breaks

Team Breaks Half Breaks Opponent Breaks Opponent Half Breaks
Australia 2 5 4 0
USA 4 0 2 5

Penalties and Cards

Team Penalties Against Yellow Cards Red Cards Opponent Penalties Opponent Yellow Cards Opponent Red Cards
Australia 4 0 0 1 0 0
USA 1 0 0 4 0 0

Offensive Passing

Team Passes Offloads Offload Rate Errors Err Rate
Australia 35 7 20.0% 0 0.0%
USA 31 3 9.7% 2 6.5%

Rucks

Team Rucks Wins Win % Opp Rucks Wins Win %
Australia 16 13 81.2% 9 0 0.0%
USA 9 9 100.0% 16 3 18.8%

Scrums

Team Scrums Wins Win % Opp Scrums Wins Win %
Australia 0 0 0.0% 0 0 0.0%
USA 0 0 0.0% 0 0 0.0%

Lineouts

Team Lineouts Wins Win % Opp Lineouts Wins Win %
Australia 1 1 100.0% 1 1 100.0%
USA 1 0 0.0% 1 0 0.0%

Hong Kong 2017 – South Africa v USA Stats

Final Score – South Africa 29, USA 24 (OT)
Referee – Sam Grove-White

Possession

Team Games Opps Opp Rate Gathers Gather Rate
South Africa 1 9 9.0 8 0.89
USA 1 8 8.0 7 0.88

Scoring

Team Tries Try Rate Con Atmpts Cons Con Rate
South Africa 5 0.62 4 2 0.5
USA 4 0.57 4 2 0.5

Offensive Meters

Team Kicking Meters Running Meters Total Meters Max. Possible Meters % of Max Gained
South Africa 45 282 327 517 63.2%
USA 47 227 274 507 54.0%

Receiving Kickoffs

Team Kickoffs Opp KO Errors Wins (w/o Errors) Win % (w/o Errors)
South Africa 5 0 4 80.0%
USA 4 0 3 75.0%

Kickoffs

Team Kickoffs Errors Wins Win % (w/ Errors)
South Africa 4 0 1 25.0
USA 5 0 1 20.0

Defensive Contact

Team Contact Opps D Successes D Success Rate D Failures D Fail Rate
South Africa 18 0 0.0% 5 27.8%
USA 27 3 11.1% 10 37.0%

Breaks

Team Breaks Half Breaks Opponent Breaks Opponent Half Breaks
South Africa 3 7 4 1
USA 4 1 3 7

Penalties and Cards

Team Penalties Against Yellow Cards Red Cards Opponent Penalties Opponent Yellow Cards Opponent Red Cards
South Africa 1 0 0 4 0 0
USA 4 0 0 1 0 0

Offensive Passing

Team Passes Offloads Offload Rate Errors Err Rate
South Africa 42 5 11.9% 2 4.8%
USA 54 5 9.3% 2 3.7%

Rucks

Team Rucks Wins Win % Opp Rucks Wins Win %
South Africa 15 14 93.3% 9 0 0.0%
USA 9 9 100.0% 15 1 6.7%

Scrums

Team Scrums Wins Win % Opp Scrums Wins Win %
South Africa 2 2 100.0% 1 0 0.0%
USA 1 1 100.0% 2 0 0.0%

Lineouts

Team Lineouts Wins Win % Opp Lineouts Wins Win %
South Africa 0 0 0.0% 0 0 0.0%
USA 0 0 0.0% 0 0 0.0%

Hong Kong 2017 – England v USA Stats

Final Score – USA 27, England 7
Referee – Craig Joubert

Possession

Team Games Opps Opp Rate Gathers Gather Rate
England 1 9 9.0 9 1.0
USA 1 10 10.0 10 1.0

Scoring

Team Tries Try Rate Con Atmpts Cons Con Rate
England 1 0.11 1 1 1.0
USA 5 0.50 5 1 0.2

Offensive Meters

Team Kicking Meters Running Meters Total Meters Max. Possible Meters % of Max Gained
England 81 205 286 580 49.3%
USA 71 340 411 599 68.6%

Receiving Kickoffs

Team Kickoffs Opp KO Errors Wins (w/o Errors) Win % (w/o Errors)
England 4 0 4 100.0%
USA 2 0 2 100.0%

Kickoffs

Team Kickoffs Errors Wins Win % (w/ Errors)
England 2 0 0 0.0
USA 4 0 0 0.0

Defensive Contact

Team Contact Opps D Successes D Success Rate D Failures D Fail Rate
England 24 4 16.7% 6 25.0%
USA 25 4 16.0% 11 44.0%

Breaks

Team Breaks Half Breaks Opponent Breaks Opponent Half Breaks
England 2 6 4 3
USA 4 3 2 6

Penalties and Cards

Team Penalties Against Yellow Cards Red Cards Opponent Penalties Opponent Yellow Cards Opponent Red Cards
England 2 0 0 2 0 0
USA 2 0 0 2 0 0

Offensive Passing

Team Passes Offloads Offload Rate Errors Err Rate
England 41 4 9.8% 3 7.3%
USA 51 8 15.7% 2 3.9%

Rucks

Team Rucks Wins Win % Opp Rucks Wins Win %
England 14 12 85.7% 7 0 0.0%
USA 7 7 100.0% 14 2 14.3%

Scrums

Team Scrums Wins Win % Opp Scrums Wins Win %
England 1 1 100.0% 1 0 0.0%
USA 1 1 100.0% 1 0 0.0%

Lineouts

Team Lineouts Wins Win % Opp Lineouts Wins Win %
England 1 1 100.0% 3 0 0.0%
USA 3 3 100.0% 1 0 0.0%

Hong Kong 2017 – Argentina v USA Stats

Final Score – USA 33, Argentina 5
Referee – Craig Joubert

Possession

Team Games Opps Opp Rate Gathers Gather Rate
Argentina 1 6 6.0 5 0.83
USA 1 7 7.0 7 1.00

Scoring

Team Tries Try Rate Con Atmpts Cons Con Rate
Argentina 1 0.20 1 0 0.0
USA 5 0.71 5 4 0.8

Offensive Meters

Team Kicking Meters Running Meters Total Meters Max. Possible Meters % of Max Gained
Argentina 37 86 123 379 32.5%
USA 0 301 301 404 74.5%

Receiving Kickoffs

Team Kickoffs Opp KO Errors Wins (w/o Errors) Win % (w/o Errors)
Argentina 4 0 3 75.0%
USA 2 0 2 100.0%

Kickoffs

Team Kickoffs Errors Wins Win % (w/ Errors)
Argentina 2 0 0 0.0
USA 4 0 1 25.0

Defensive Contact

Team Contact Opps D Successes D Success Rate D Failures D Fail Rate
Argentina 21 1 4.8% 9 42.9%
USA 21 2 9.5% 5 23.8%

Breaks

Team Breaks Half Breaks Opponent Breaks Opponent Half Breaks
Argentina 0 2 6 1
USA 6 1 0 2

Penalties and Cards

Team Penalties Against Yellow Cards Red Cards Opponent Penalties Opponent Yellow Cards Opponent Red Cards
Argentina 2 0 0 4 0 0
USA 4 0 0 2 0 0

Offensive Passing

Team Passes Offloads Offload Rate Errors Err Rate
Argentina 29 0 0.0% 2 6.9%
USA 30 8 26.7% 2 6.7%

Rucks

Team Rucks Wins Win % Opp Rucks Wins Win %
Argentina 15 14 93.3% 6 0 0.0%
USA 6 6 100.0% 15 1 6.7%

Scrums

Team Scrums Wins Win % Opp Scrums Wins Win %
Argentina 2 2 100.0% 2 0 0.0%
USA 2 2 100.0% 2 0 0.0%

Lineouts

Team Lineouts Wins Win % Opp Lineouts Wins Win %
Argentina 2 2 100.0% 1 0 0.0%
USA 1 1 100.0% 2 0 0.0%

Hong Kong 2017 – Scotland v USA Stats

Final Score – USA 19, Scotland 14
Referee – Richard Kelly

Possession

Team Games Opps Opp Rate Gathers Gather Rate
Scotland 1 9 9.0 8 0.89
USA 1 9 9.0 8 0.89

Scoring

Team Tries Try Rate Con Atmpts Cons Con Rate
Scotland 2 0.25 2 2 1.00
USA 3 0.38 3 2 0.67

Offensive Meters

Team Kicking Meters Running Meters Total Meters Max. Possible Meters % of Max Gained
Scotland 0 202 202 470 43.0%
USA 54 153 207 639 32.4%

Receiving Kickoffs

Team Kickoffs Opp KO Errors Wins (w/o Errors) Win % (w/o Errors)
Scotland 3 0 2 66.7%
USA 3 0 2 66.7%

Kickoffs

Team Kickoffs Errors Wins Win % (w/ Errors)
Scotland 3 0 1 33.3
USA 3 0 1 33.3

Defensive Contact

Team Contact Opps D Successes D Success Rate D Failures D Fail Rate
Scotland 14 3 21.4% 3 21.4%
USA 34 5 14.7% 9 26.5%

Breaks

Team Breaks Half Breaks Opponent Breaks Opponent Half Breaks
Scotland 4 4 2 0
USA 2 0 4 4

Penalties and Cards

Team Penalties Against Yellow Cards Red Cards Opponent Penalties Opponent Yellow Cards Opponent Red Cards
Scotland 4 0 0 3 0 0
USA 3 0 0 4 0 0

Offensive Passing

Team Passes Offloads Offload Rate Errors Err Rate
Scotland 48 11 22.9% 4 8.3%
USA 23 6 26.1% 5 21.7%

Rucks

Team Rucks Wins Win % Opp Rucks Wins Win %
Scotland 16 14 87.5% 3 0 0.0%
USA 3 3 100.0% 16 2 12.5%

Scrums

Team Scrums Wins Win % Opp Scrums Wins Win %
Scotland 3 3 100.0% 1 0 0.0%
USA 1 1 100.0% 3 0 0.0%

Lineouts

Team Lineouts Wins Win % Opp Lineouts Wins Win %
Scotland 0 0 0.0% 2 0 0.0%
USA 2 2 100.0% 0 0 0.0%

Hong Kong 2017 – Russia v USA Stats

Final Score – USA 14, Russia 7
Referee – Damon Murphy

Possession

Team Games Opps Opp Rate Gathers Gather Rate
Russia 1 6 6.0 5 0.83
USA 1 6 6.0 6 1.00

Scoring

Team Tries Try Rate Con Atmpts Cons Con Rate
Russia 1 0.20 1 1 1.0
USA 2 0.33 2 2 1.0

Offensive Meters

Team Kicking Meters Running Meters Total Meters Max. Possible Meters % of Max Gained
Russia 19 154 173 399 43.4%
USA 19 182 201 332 60.5%

Receiving Kickoffs

Team Kickoffs Opp KO Errors Wins (w/o Errors) Win % (w/o Errors)
Russia 2 0 1 50.0%
USA 2 0 2 100.0%

Kickoffs

Team Kickoffs Errors Wins Win % (w/ Errors)
Russia 2 0 0 0.0
USA 2 0 1 50.0

Defensive Contact

Team Contact Opps D Successes D Success Rate D Failures D Fail Rate
Russia 10 2 20.0% 2 20.0%
USA 39 4 10.3% 9 23.1%

Breaks

Team Breaks Half Breaks Opponent Breaks Opponent Half Breaks
Russia 2 6 3 1
USA 3 1 2 6

Penalties and Cards

Team Penalties Against Yellow Cards Red Cards Opponent Penalties Opponent Yellow Cards Opponent Red Cards
Russia 2 0 0 6 0 0
USA 6 0 0 2 0 0

Offensive Passing

Team Passes Offloads Offload Rate Errors Err Rate
Russia 51 5 9.8% 1 2.0%
USA 28 3 10.7% 4 14.3%

Rucks

Team Rucks Wins Win % Opp Rucks Wins Win %
Russia 27 25 92.6% 4 0 0.0%
USA 4 4 100.0% 27 2 7.4%

Scrums

Team Scrums Wins Win % Opp Scrums Wins Win %
Russia 5 5 100.0% 0 0 0.0%
USA 0 0 0.0% 5 0 0.0%

Lineouts

Team Lineouts Wins Win % Opp Lineouts Wins Win %
Russia 1 1 100.0% 1 0 0.0%
USA 1 1 100.0% 1 0 0.0%

Hong Kong 2017 Predictions

Pool A

Australia look to bounce back from a poor Vancouver performance, in part due to untimely turnovers near the try line. Samoa has improved through the year and their handling errors and tackling failures are starting to decrease. But they are still likely destined for the Challenge rounds. England versus Samoa will be a rematch of the feisty Las Vegas game where a season-high 13 penalties were dished out.

Team Pool Win % Quarter-Final %
England 81 % 98 %
Australia 16 % 76 %
Samoa 2 % 26 %
South Korea <1 % <1 %

Pool B

After another loss to England, South Africa looks vulnerable. The Blitzboks, without Speckman, Geduld, Brown, Smith, Senatla, and Dippennar, may not be as dominant as earlier this season but they are still clearly the leaders for this otherwise well-balanced pool. Kenya will be missing Ambaka and Sikuta while France was anticipating a return of Vakatawa before injury ruled him out. Meanwhile the Canadians are without big man Adam Zaruba and Phil Berna. Combined, the teams are fielding five debutants.

Team Pool Win % Quarter-Final %
South Africa 98 % >99 %
Canada 1 % 37 %
Kenya <1 % 37 %
France <1 % 27 %

Pool C

Fiji versus New Zealand in Hong Kong, you don’t say. The likely pool decider will surely bring the crowd to their feet. NZ and Japan haven’t played since Japan’s upset in Rio, but considering Japan’s current form, it should be a one-sided affair. Wales is fairly bad in the first half, and quite good in the second half so far this season. If they can keep games tight until halftime, they could pull off an upset.

Team Pool Win % Quarter-Final %
Fiji 56 % 93 %
New Zealand 41 % 90 %
Wales 4 % 17 %
Japan <1 % <1 %

Pool D

The USA has edged Argentina in two very exciting quarter-finals in the past two tournaments. The USA holds a strong edge at the kickoff and gaining an extra possession or two could be all the edge they need. Scotland has continued to decline and suffered a loss to Russia in Vancouver. Scotland’s numbers are still bolstered by early-season success but they are slowly becoming a below-average team.

Team Pool Win % Quarter-Final %
USA 58 % 88 %
Argentina 29 % 70 %
Scotland 12 % 41 %
Russia <1 % 1 %

Tournament Finish

I finally finished a full tournament simulator and the distribution for each team’s finish is below. South Africa have a 59% chance of winning the tournament. But you may want to bring that number down considering their injuries.

The simulator considers how the pools crossover which is why the USA is more likely to make the top four than New Zealand even though a head-to-head matchup between the two teams would favor the kiwis. NZ has a greater likelihood of finishing second in their pool, mostly due to Fiji. And if NZ does finish second, they likely meet South Africa in the quarters. The USA avoids South Africa and would likely face Australia in the quarters. A second-place pool finish for the Eagles should pit them against England, a difficult matchup but not as tough as South Africa.

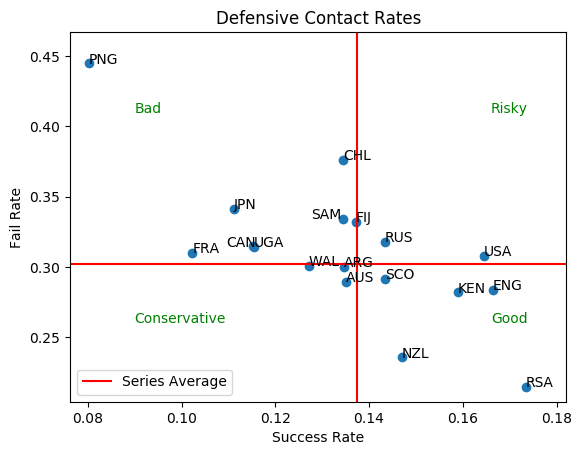
Contact Success and Failure Updates

With some suggestions from Jacob Liberman I’ve updated how I track contact success and failure. You may have noticed this in the stats I recently posted for Vancouver. At some point I will likely update the stats from previous tournaments as well.

The old method considered all made tackles as “contact successes” while lumping missed tackles and offloads together as “contact failures”. First, I never liked that offloads were coded as failures. I don’t believe offloads are inherently successful. Success is determined by the result of the offload; Did it create a break? Did it result in a turnover? This outcome-based classification should also apply to made tackles. Missing a tackle is bad, creating a turnover is good, and making a tackle is just something you do to prevent a missed tackle and create the opportunity for a turnover. As these shortcomings suggest, the old method was unsatisfactory in identifying the success of teams in contact situations.

Now made tackles that don’t result in a turnover and completed offloads that don’t result in a turnover or a break are considered “neutral events”, neither success nor failure. Given that turnovers and breaks are relatively uncommon, most teams will have a large portion of their contact situations classified as neutral. Missed tackles, half-breaks, breaks, and especially turnovers are the significant moments in a possession. The new method classifies these events accordingly.

To help illustrate the change, I included a chart that plots contact success rate and contact failure rate by team through the Vancouver tournament. It’s a first stab at determining whether the new method is useful for identifying teams strong or weak in contact. The rates seem to not only identify differences in teams but do so in a way that correlates with other important defensive metrics like opposition try rate, opposition breaks, and opposition meters. Considering how a large portion of defense is based on contact, this is encouraging.

There is certainly more to be learned from contact success and failure. But tracking those situations according to their outcomes – and, in doing so, describing more precisely which teams are “good at contact” – should provide a better foundation for answering future questions.

Vancouver 2017 Stats

Adjusted Rates

Team Adj Try Rate Opponent Adj Try Rate Adj Gather Rate Opponent Adj Gather Rate Adj Margin
England 0.50 0.13 0.98 0.73 21.91
South Africa 0.52 0.13 0.95 0.89 19.74
USA 0.54 0.39 0.92 0.65 11.32
New Zealand 0.55 0.28 0.85 0.90 9.55
Fiji 0.64 0.49 0.88 0.83 8.91
Wales 0.36 0.24 0.90 0.90 7.13
Argentina 0.40 0.27 0.91 0.91 6.82
Samoa 0.45 0.37 0.78 0.84 2.66
Canada 0.43 0.52 0.84 0.83 -0.16
Kenya 0.42 0.46 0.76 0.87 -3.94
Chile 0.26 0.42 0.77 0.77 -7.32
Australia 0.16 0.29 0.90 0.91 -7.64
France 0.33 0.55 0.93 0.85 -10.04
Scotland 0.36 0.61 0.89 0.95 -15.85
Russia 0.03 0.47 0.75 0.98 -22.25
Japan 0.25 0.62 0.70 0.96 -22.54

Possession

Team Games Opps Opp Rate Gathers Gather Rate
Argentina 6 48 8.00 42 0.88
Australia 5 47 9.40 41 0.87
Canada 5 33 6.60 30 0.91
Chile 5 42 8.40 33 0.79
England 6 51 8.50 50 0.98
Fiji 6 48 8.00 41 0.85
France 5 42 8.40 39 0.93
Japan 6 48 8.00 34 0.71
Kenya 5 40 8.00 30 0.75
New Zealand 6 46 7.67 40 0.87
South Africa 6 47 7.83 40 0.85
Russia 5 39 7.80 30 0.77
Samoa 6 51 8.50 41 0.80
Scotland 6 43 7.17 40 0.93
USA 6 49 8.17 47 0.96
Wales 6 54 9.00 49 0.91

Scoring

Team Tries Try Rate Con Atmpts Cons Con Rate
Argentina 16 0.38 16 11 0.69
Australia 11 0.27 11 4 0.36
Canada 12 0.40 12 10 0.83
Chile 6 0.18 6 2 0.33
England 21 0.42 20 16 0.80
Fiji 22 0.54 22 15 0.68
France 15 0.38 15 12 0.80
Japan 10 0.29 10 8 0.80
Kenya 11 0.37 11 8 0.73
New Zealand 22 0.55 22 14 0.64
South Africa 19 0.48 19 11 0.58
Russia 3 0.10 3 1 0.33
Samoa 17 0.41 16 12 0.75
Scotland 18 0.45 15 9 0.60
USA 26 0.55 25 16 0.64
Wales 19 0.39 19 16 0.84

Opponent Possession

Team Games Opponent Opps Opponent Opp Rate Opponent Gathers Opponent Gather Rate
Argentina 6 48 8.00 44 0.92
Australia 5 43 8.60 39 0.91
Canada 5 33 6.60 28 0.85
Chile 5 45 9.00 35 0.78
England 6 49 8.17 36 0.73
Fiji 6 48 8.00 42 0.88
France 5 43 8.60 36 0.84
Japan 6 52 8.67 51 0.98
Kenya 5 40 8.00 35 0.88
New Zealand 6 46 7.67 42 0.91
South Africa 6 49 8.17 45 0.92
Russia 5 40 8.00 37 0.92
Samoa 6 51 8.50 44 0.86
Scotland 6 40 6.67 36 0.90
USA 6 48 8.00 32 0.67
Wales 6 53 8.83 45 0.85

Opponent Scoring

Team Opponent Tries Opponent Try Rate Opponent Con Atmpts Opponent Cons Opponent Con Rate
Argentina 16 0.36 16 10 0.62
Australia 14 0.36 14 11 0.79
Canada 15 0.54 14 4 0.29
Chile 15 0.43 15 12 0.80
England 8 0.22 8 6 0.75
Fiji 21 0.50 20 13 0.65
France 18 0.50 17 14 0.82
Japan 28 0.55 27 18 0.67
Kenya 17 0.49 16 10 0.62
New Zealand 8 0.19 7 7 1.00
South Africa 9 0.20 9 4 0.44
Russia 17 0.46 17 10 0.59
Samoa 17 0.39 17 13 0.76
Scotland 20 0.56 20 17 0.85
USA 12 0.38 12 9 0.75
Wales 13 0.29 13 7 0.54

Offensive Meters

Team Kicking Meters Running Meters Total Meters Max. Possible Meters % of Max Gained
Argentina 363 1137 1500 2982 50.3%
Australia 109 1235 1344 2665 50.4%
Canada 179 976 1155 2209 52.3%
Chile 193 426 619 2684 23.1%
England 514 1457 1971 2863 68.8%
Fiji 114 1687 1801 2972 60.6%
France 373 987 1360 2570 52.9%
Japan 101 1058 1159 3031 38.2%
Kenya 0 1136 1136 2524 45.0%
New Zealand 440 1352 1792 2834 63.2%
South Africa 97 1240 1337 2944 45.4%
Russia 231 541 772 2591 29.8%
Samoa 362 1309 1671 3389 49.3%
Scotland 198 1389 1587 2869 55.3%
USA 273 1542 1815 2885 62.9%
Wales 182 1628 1810 3237 55.9%

Defensive Meters

Team Kicking Meters Running Meters Total Meters Max. Possible Meters % of Max Gained
Argentina 204 1425 1629 3060 53.2%
Australia 399 1053 1452 3018 48.1%
Canada 257 861 1118 2087 53.6%
Chile 142 817 959 2333 41.1%
England 215 1128 1343 3458 38.8%
Fiji 284 1458 1742 2997 58.1%
France 157 1369 1526 2782 54.9%
Japan 163 1701 1864 2891 64.5%
Kenya 323 1007 1330 2419 55.0%
New Zealand 202 1145 1347 3140 42.9%
South Africa 418 853 1271 2893 43.9%
Russia 192 1108 1300 2506 51.9%
Samoa 163 1676 1839 2878 63.9%
Scotland 212 1266 1478 2620 56.4%
USA 137 1058 1195 3007 39.7%
Wales 261 1175 1436 3160 45.4%

Receiving Kickoffs

Team Kickoffs Opp KO Errors Wins (w/o Errors) Win % (w/o Errors)
Argentina 19 1 15 83.3%
Australia 18 2 11 68.8%
Canada 18 0 17 94.4%
Chile 17 2 11 73.3%
England 12 1 11 100.0%
Fiji 24 1 16 69.6%
France 19 2 15 88.2%
Japan 28 1 14 51.9%
Kenya 18 0 9 50.0%
New Zealand 13 0 9 69.2%
South Africa 14 0 10 71.4%
Russia 18 1 13 76.5%
Samoa 18 0 11 61.1%
Scotland 25 2 20 87.0%
USA 15 1 12 85.7%
Wales 16 0 13 81.2%

Kickoffs

Team Kickoffs Errors Wins Win % (w/ Errors)
Argentina 19 0 2 10.5
Australia 14 1 4 28.6
Canada 15 1 4 26.7
Chile 10 0 4 40.0
England 23 0 10 43.5
Fiji 22 1 5 22.7
France 17 0 6 35.3
Japan 15 2 0 0.0
Kenya 15 1 4 26.7
New Zealand 23 4 3 13.0
South Africa 22 0 1 4.5
Russia 8 0 0 0.0
Samoa 20 0 6 30.0
Scotland 20 2 3 15.0
USA 28 1 12 42.9
Wales 21 1 7 33.3

Defensive Contact

Team Contact Opps D Successes D Success Rate D Failures D Fail Rate
Argentina 135 22 16.3% 41 30.4%
Australia 90 15 16.7% 30 33.3%
Canada 106 11 10.4% 41 38.7%
Chile 81 15 18.5% 23 28.4%
England 94 21 22.3% 24 25.5%
Fiji 144 14 9.7% 51 35.4%
France 120 11 9.2% 43 35.8%
Japan 161 13 8.1% 52 32.3%
Kenya 92 10 10.9% 28 30.4%
New Zealand 149 21 14.1% 37 24.8%
South Africa 143 22 15.4% 20 14.0%
Russia 122 16 13.1% 33 27.0%
Samoa 155 19 12.3% 54 34.8%
Scotland 120 11 9.2% 45 37.5%
USA 101 15 14.9% 27 26.7%
Wales 134 24 17.9% 39 29.1%

Offensive Contact

Team Contact Opps D Successes D Success Rate D Failures D Fail Rate
Argentina 130 17 13.1% 38 29.2%
Australia 141 19 13.5% 48 34.0%
Canada 119 13 10.9% 24 20.2%
Chile 93 18 19.4% 20 21.5%
England 146 16 11.0% 45 30.8%
Fiji 144 16 11.1% 44 30.6%
France 108 12 11.1% 46 42.6%
Japan 110 18 16.4% 37 33.6%
Kenya 101 15 14.9% 27 26.7%
New Zealand 110 14 12.7% 48 43.6%
South Africa 98 14 14.3% 34 34.7%
Russia 92 19 20.7% 19 20.7%
Samoa 129 20 15.5% 40 31.0%
Scotland 161 13 8.1% 47 29.2%
USA 146 15 10.3% 41 28.1%
Wales 119 21 17.6% 30 25.2%

Breaks

Team Breaks Half Breaks Opponent Breaks Opponent Half Breaks
Argentina 15 13 28 14
Australia 15 20 17 4
Canada 17 9 12 5
Chile 9 8 13 12
England 20 21 14 9
Fiji 25 7 25 17
France 17 16 17 14
Japan 16 14 26 10
Kenya 17 5 14 9
New Zealand 23 9 13 19
South Africa 13 7 11 6
Russia 3 14 15 13
Samoa 23 15 19 14
Scotland 15 17 24 12
USA 26 6 10 17
Wales 25 11 21 17

Penalties and Cards

Team Penalties Against Yellow Cards Red Cards Opponent Penalties Opponent Yellow Cards Opponent Red Cards
Argentina 23 4 1 20 1 0
Australia 18 0 0 23 3 0
Canada 16 0 0 25 3 0
Chile 23 0 0 13 0 0
England 15 0 0 24 2 0
Fiji 18 2 0 13 0 0
France 20 3 0 14 2 0
Japan 19 3 0 16 2 0
Kenya 15 1 0 17 1 0
New Zealand 15 2 0 24 1 0
South Africa 27 1 0 16 0 0
Russia 18 3 0 16 0 0
Samoa 19 2 0 20 0 0
Scotland 19 0 0 22 3 0
USA 16 1 0 20 0 0
Wales 16 0 0 14 2 1

Offensive Passing

Team Passes Offloads Offload Rate Errors Err Rate
Argentina 192 32 16.7% 8 4.2%
Australia 176 15 8.5% 11 6.2%
Canada 194 19 9.8% 8 4.1%
Chile 164 17 10.4% 13 7.9%
England 350 22 6.3% 9 2.6%
Fiji 216 60 27.8% 10 4.6%
France 168 17 10.1% 10 6.0%
Japan 207 28 13.5% 13 6.3%
Kenya 154 22 14.3% 12 7.8%
New Zealand 200 21 10.5% 7 3.5%
South Africa 139 9 6.5% 11 7.9%
Russia 147 14 9.5% 12 8.2%
Samoa 158 25 15.8% 15 9.5%
Scotland 335 41 12.2% 10 3.0%
USA 282 44 15.6% 12 4.3%
Wales 313 29 9.3% 13 4.2%

Defensive Passing

Team Passes Offloads Offload Rate Errors Err Rate
Argentina 205 27 13.2% 11 5.4%
Australia 142 23 16.2% 8 5.6%
Canada 147 23 15.6% 8 5.4%
Chile 168 14 8.3% 13 7.7%
England 155 22 14.2% 9 5.8%
Fiji 228 34 14.9% 12 5.3%
France 204 24 11.8% 9 4.4%
Japan 288 28 9.7% 12 4.2%
Kenya 203 19 9.4% 6 3.0%
New Zealand 234 34 14.5% 16 6.8%
South Africa 296 19 6.4% 16 5.4%
Russia 249 28 11.2% 6 2.4%
Samoa 344 38 11.0% 11 3.2%
Scotland 171 15 8.8% 8 4.7%
USA 169 27 16.0% 7 4.1%
Wales 192 40 20.8% 22 11.5%

Rucks

Team Rucks Wins Win % Opp Rucks Wins Win %
Argentina 52 45 86.5% 69 10 14.5%
Australia 81 73 90.1% 35 9 25.7%
Canada 76 67 88.2% 41 5 12.2%
Chile 48 38 79.2% 37 3 8.1%
England 79 72 91.1% 41 9 22.0%
Fiji 33 31 93.9% 64 4 6.2%
France 44 38 86.4% 58 4 6.9%
Japan 45 38 84.4% 78 5 6.4%
Kenya 43 41 95.3% 50 9 18.0%
New Zealand 42 35 83.3% 85 12 14.1%
South Africa 44 38 86.4% 86 7 8.1%
Russia 62 51 82.3% 54 8 14.8%
Samoa 68 61 89.7% 52 6 11.5%
Scotland 82 74 90.2% 65 6 9.2%
USA 57 53 93.0% 48 8 16.7%
Wales 56 49 87.5% 49 3 6.1%

Scrums

Team Scrums Wins Win % Opp Scrums Wins Win %
Argentina 9 7 77.8% 8 0 0.0%
Australia 6 6 100.0% 5 0 0.0%
Canada 5 4 80.0% 7 1 14.3%
Chile 12 10 83.3% 7 1 14.3%
England 5 5 100.0% 9 1 11.1%
Fiji 8 8 100.0% 6 0 0.0%
France 2 2 100.0% 7 0 0.0%
Japan 13 12 92.3% 4 0 0.0%
Kenya 7 7 100.0% 8 0 0.0%
New Zealand 11 10 90.9% 5 1 20.0%
South Africa 8 7 87.5% 6 1 16.7%
Russia 5 4 80.0% 11 1 9.1%
Samoa 4 4 100.0% 9 1 11.1%
Scotland 6 6 100.0% 8 1 12.5%
USA 6 6 100.0% 6 2 33.3%
Wales 10 9 90.0% 11 0 0.0%

Lineouts

Team Lineouts Wins Win % Opp Lineouts Wins Win %
Argentina 11 9 81.8% 4 1 25.0%
Australia 4 3 75.0% 12 1 8.3%
Canada 6 6 100.0% 6 0 0.0%
Chile 7 3 42.9% 9 4 44.4%
England 8 8 100.0% 8 2 25.0%
Fiji 4 3 75.0% 7 2 28.6%
France 9 8 88.9% 3 1 33.3%
Japan 6 6 100.0% 7 1 14.3%
Kenya 2 1 50.0% 4 0 0.0%
New Zealand 8 8 100.0% 6 0 0.0%
South Africa 4 3 75.0% 12 2 16.7%
Russia 10 7 70.0% 5 1 20.0%
Samoa 12 10 83.3% 3 0 0.0%
Scotland 2 2 100.0% 8 0 0.0%
USA 10 10 100.0% 4 2 50.0%
Wales 4 3 75.0% 9 0 0.0%

Vancouver 2017 – England v South Africa Stats

Possession

Team Games Opps Opp Rate Gathers Gather Rate
England 1 10 10.0 9 0.90
South Africa 1 9 9.0 8 0.89

Scoring

Team Tries Try Rate Con Atmpts Cons Con Rate
England 3 0.33 3 2 0.67
South Africa 1 0.12 1 1 1.00

Offensive Meters

Team Kicking Meters Running Meters Total Meters Max. Possible Meters % of Max Gained
England 131 208 339 566 59.9%
South Africa 20 213 233 598 39.0%

Receiving Kickoffs

Team Kickoffs Opp KO Errors Wins (w/o Errors) Win % (w/o Errors)
England 2 0 2 100.0%
South Africa 3 0 2 66.7%

Kickoffs

Team Kickoffs Errors Wins Win % (w/ Errors)
England 3 0 1 33.3
South Africa 2 0 0 0.0

Defensive Contact

Team Contact Opps D Successes D Success Rate D Failures D Fail Rate
England 19 6 31.6% 2 10.5%
South Africa 20 4 20.0% 0 0.0%

Breaks

Team Breaks Half Breaks Opponent Breaks Opponent Half Breaks
England 4 1 1 0
South Africa 1 0 4 1

Penalties and Cards

Team Penalties Against Yellow Cards Red Cards Opponent Penalties Opponent Yellow Cards Opponent Red Cards
England 6 0 0 3 0 0
South Africa 3 0 0 6 0 0

Offensive Passing

Team Passes Offloads Offload Rate Errors Err Rate
England 62 1 1.6% 1 1.6%
South Africa 27 3 11.1% 2 7.4%

Rucks

Team Rucks Wins Win % Opp Rucks Wins Win %
England 17 14 82.4% 12 3 25.0%
South Africa 12 9 75.0% 17 3 17.6%

Scrums

Team Scrums Wins Win % Opp Scrums Wins Win %
England 0 0 0.0% 1 0 0.0%
South Africa 1 1 100.0% 0 0 0.0%

Lineouts

Team Lineouts Wins Win % Opp Lineouts Wins Win %
England 3 3 100.0% 1 0 0.0%
South Africa 1 1 100.0% 3 0 0.0%