Paris 2017 – Samoa v USA Stats

Team SAM USA
Score 19 24
Possessions / Opportunities 6/9 (67 %) 8/8 (100 %)
Tries / Possessions 3/6 (50 %) 4/8 (50 %)
Conversions 2/3 (67 %) 2/4 (50 %)
DGs and PKs 0/0 (0 %) 0/0 (0 %)
Receiving Kickoffs 2/5 (40 %) 3/3 (100 %)
Kickoffs 0/3 (0 %) 3/5 (60 %)
Meters / Possible 194/471 (41 %) 188/529 (36 %)
Running Meters 194 188
Kicking Meters 0 0
Breaks 5 4
Half Breaks 3 1
Penalties Conceded 1 2
Yellow Cards 0 1
Red Cards 0 0
Tackles 12 13
Contact Successes 2/21 (10 %) 2/22 (9 %)
Contact Failures 5/21 (24 %) 9/22 (41 %)
Rucks 9/10 (90 %) 9/9 (100 %)
Scrums 2/2 (100 %) 2/2 (100 %)
Lineouts 0/0 (0 %) 0/0 (0 %)
Offloads / Passes 4/23 (17 %) 4/56 (7 %)
Handling Errors 3/23 (13 %) 2/56 (4 %)

Referee – Sam Grove-White

Paris 2017 – Fiji v USA Stats

Team FIJ USA
Score 14 24
Possessions / Opportunities 7/12 (58 %) 10/12 (83 %)
Tries / Possessions 2/7 (29 %) 4/10 (40 %)
Conversions 2/2 (100 %) 2/4 (50 %)
DGs and PKs 0/0 (0 %) 0/0 (0 %)
Receiving Kickoffs 1/4 (25 %) 1/3 (33 %)
Kickoffs 2/3 (67 %) 3/4 (75 %)
Meters / Possible 285/741 (38 %) 363/699 (52 %)
Running Meters 257 339
Kicking Meters 28 24
Breaks 4 4
Half Breaks 1 3
Penalties Conceded 6 3
Yellow Cards 2 0
Red Cards 0 0
Tackles 10 8
Contact Successes 4/19 (21 %) 4/20 (20 %)
Contact Failures 6/19 (32 %) 5/20 (25 %)
Rucks 5/7 (71 %) 6/8 (75 %)
Scrums 0/1 (0 %) 1/1 (100 %)
Lineouts 2/3 (67 %) 1/1 (100 %)
Offloads / Passes 6/19 (32 %) 6/46 (13 %)
Handling Errors 2/19 (11 %) 2/46 (4 %)

Referee – Pierre Brousset

Paris 2017 – England v USA Stats

Team ENG USA
Score 26 12
Possessions / Opportunities 6/6 (100 %) 5/5 (100 %)
Tries / Possessions 4/6 (67 %) 2/5 (40 %)
Conversions 3/4 (75 %) 1/2 (50 %)
DGs and PKs 0/0 (0 %) 0/0 (0 %)
Receiving Kickoffs 3/3 (100 %) 3/3 (100 %)
Kickoffs 0/3 (0 %) 0/3 (0 %)
Meters / Possible 241/351 (69 %) 107/253 (42 %)
Running Meters 225 107
Kicking Meters 16 0
Breaks 6 0
Half Breaks 1 3
Penalties Conceded 2 4
Yellow Cards 0 0
Red Cards 0 0
Tackles 9 12
Contact Successes 2/10 (20 %) 1/16 (6 %)
Contact Failures 2/10 (20 %) 5/16 (31 %)
Rucks 11/12 (92 %) 8/8 (100 %)
Scrums 1/1 (100 %) 2/2 (100 %)
Lineouts 2/2 (100 %) 1/1 (100 %)
Offloads / Passes 0/38 (0 %) 0/38 (0 %)
Handling Errors 1/38 (3 %) 2/38 (5 %)

Referee – Craig Evans

Conversion Leaders

I decided to go digging into some of World Rugby’s stats and started with conversions since they are pretty easy. World Rugby displays the players with the most conversions but they don’t display their conversion success rate. And they only display the leaders, not a complete list.

Below is a complete list along with each player’s success rate through the first day of Paris. The table is sorted by total conversions to keep the most common kickers at the top. If sorted by success rate you’ll get a bunch of players who are kicking 100% on just a few attempts. But feel free to sort the table however you would like.

Eventually I plan to tie the table below to some of my data so we know each conversion’s width. Perhaps Scott Wight benefits from centered tries. Knowing the width will help us evaluate each kicker by the difficulty of the conversions they have attempted. But for now, at least we have the individual success rates.

Player Team Cons Con Attempts Con %
Scott Wight SCO 83 107 77.6 %
Madison Hughes USA 80 126 63.5 %
Tom Mitchell ENG 73 102 71.6 %
Osea Kolinisau FIJ 72 101 71.3 %
Ethan Davies WAL 72 100 72.0 %
Tila Mealoi SAM 66 101 65.3 %
James Stannard AUS 62 103 60.2 %
Branco Du Preez RSA 61 96 63.5 %
Nathan Hirayama CAN 59 91 64.8 %
Gaston Revol ARG 54 83 65.1 %
Terry Bouhraoua FRA 43 57 75.4 %
Katsuyuki Sakai JPN 36 50 72.0 %
Rocky Khan NZL 33 45 73.3 %
Vatemo Ravouvou FIJ 32 51 62.7 %
Beaudein Waaka NZL 30 46 65.2 %
Justin Geduld RSA 27 45 60.0 %
Samuel Oliech KEN 27 45 60.0 %
Eden Agero KEN 25 37 67.6 %
Cecil Afrika RSA 24 39 61.5 %
Daniel Bibby ENG 21 34 61.8 %
Dmitry Sukhin RUS 21 45 46.7 %
Vilimoni Koroi NZL 19 40 47.5 %
Pat Kay CAN 18 30 60.0 %
Stephen Tomasin USA 17 23 73.9 %
Tom Lucas AUS 16 21 76.2 %
Lugonzo Augustine Ligamy KEN 16 25 64.0 %
Javier Rojas ARG 16 25 64.0 %
Jean Pascal Barraque FRA 15 22 68.2 %
Leon Ellison JPN 12 16 75.0 %
Philip Wokorach UGA 11 19 57.9 %
Stephen Parez FRA 10 14 71.4 %
Gavin Lowe SCO 10 16 62.5 %
Jeremy Aicardi FRA 9 13 69.2 %
Isaac Te Tamaki NZL 9 12 75.0 %
Kitione Taliga FIJ 8 10 80.0 %
Brian Tanga KEN 8 14 57.1 %
Amenoni Nasilasila FIJ 7 11 63.6 %
Waisea Nacuqu FIJ 7 11 63.6 %
Billy McBryde WAL 7 9 77.8 %
Marcelo Torrealba CHL 6 12 50.0 %
Alivereti Veitokani FIJ 6 10 60.0 %
Will Edwards ENG 5 5 100.0 %
Arthur Clement PNG 5 8 62.5 %
Luke Treharne WAL 5 8 62.5 %
Kosuke Hashino JPN 5 7 71.4 %
German Davydov RUS 4 10 40.0 %
Sam Caslick AUS 4 6 66.7 %
Joaquin Riera ARG 4 8 50.0 %
Folau Niua USA 4 10 40.0 %
Jamie Hood HKG 4 8 50.0 %
Mike Fuailefau CAN 3 5 60.0 %
Dmitry Perov RUS 3 10 30.0 %
Alatasi Tupou SAM 3 5 60.0 %
Kevin Kermundu UGA 3 3 100.0 %
Domingo Miotti ARG 3 5 60.0 %
Emmanuel Guise PNG 2 3 66.7 %
Gregor Hunter SCO 2 3 66.7 %
Rosko Specman RSA 2 2 100.0 %
Han Gumin KOR 2 2 100.0 %
Jonathan Ruru NZL 2 5 40.0 %
Julien Candelon FRA 2 2 100.0 %
John Porch AUS 2 3 66.7 %
Fernando Luna ARG 2 3 66.7 %
Morgan Williams WAL 1 3 33.3 %
Tate McDermott AUS 1 2 50.0 %
Tim Mikkelson NZL 1 3 33.3 %
Mikhail Kudinov RUS 1 1 100.0 %
Jamie Henry JPN 1 1 100.0 %
Selvyn Davids RSA 1 1 100.0 %
Vladimir Ostroushko RUS 1 2 50.0 %
Emosi Mulevoro FIJ 1 1 100.0 %
Lautaro Bazan Velez ARG 1 5 20.0 %
Andrew Durutalo USA 1 1 100.0 %
Vincent Inigo FRA 1 2 50.0 %
Yury Gostyuzhev RUS 1 3 33.3 %
Ilya Babaev RUS 1 1 100.0 %
George Horne SCO 1 1 100.0 %
James Johnstone SCO 1 1 100.0 %
Nick McLennan SCO 1 1 100.0 %
Lloyd Evans WAL 1 2 50.0 %
Blair Kinghorn SCO 1 2 50.0 %
Josua Vici FIJ 1 1 100.0 %
Tomasi Alosio SAM 1 1 100.0 %
Ruhan Nel RSA 1 3 33.3 %
Patrick Stehlin JPN 1 1 100.0 %
Laaloi Leilual SAM 1 1 100.0 %

Paris 2017 – New Zealand v USA Stats

Team NZL USA
Score 27 14
Possessions / Opportunities 7/7 (100 %) 7/7 (100 %)
Tries / Possessions 5/7 (71 %) 2/7 (29 %)
Conversions 1/5 (20 %) 2/2 (100 %)
DGs and PKs 0/0 (0 %) 0/0 (0 %)
Receiving Kickoffs 2/2 (100 %) 5/5 (100 %)
Kickoffs 0/5 (0 %) 0/3 (0 %)
Meters / Possible 326/352 (93 %) 298/582 (51 %)
Running Meters 326 276
Kicking Meters 0 22
Breaks 7 3
Half Breaks 0 1
Penalties Conceded 2 1
Yellow Cards 0 0
Red Cards 0 0
Tackles 13 13
Contact Successes 5/19 (26 %) 2/28 (7 %)
Contact Failures 4/19 (21 %) 12/28 (43 %)
Rucks 11/12 (92 %) 8/10 (80 %)
Scrums 2/2 (100 %) 0/0 (0 %)
Lineouts 0/0 (0 %) 1/1 (100 %)
Offloads / Passes 3/43 (7 %) 4/33 (12 %)
Handling Errors 1/43 (2 %) 2/33 (6 %)

Referee – Craig Joubert

Paris 2017 – USA v Wales Stats

Team USA WAL
Score 38 14
Possessions / Opportunities 6/6 (100 %) 4/5 (80 %)
Tries / Possessions 6/6 (100 %) 2/4 (50 %)
Conversions 4/6 (67 %) 2/2 (100 %)
DGs and PKs 0/0 (0 %) 0/0 (0 %)
Receiving Kickoffs 3/3 (100 %) 5/6 (83 %)
Kickoffs 1/6 (17 %) 0/3 (0 %)
Meters / Possible 362/362 (100 %) 175/402 (44 %)
Running Meters 362 163
Kicking Meters 0 12
Breaks 7 3
Half Breaks 1 6
Penalties Conceded 1 2
Yellow Cards 0 0
Red Cards 0 0
Tackles 6 7
Contact Successes 1/11 (9 %) 0/18 (0 %)
Contact Failures 6/11 (55 %) 9/18 (50 %)
Rucks 6/6 (100 %) 5/5 (100 %)
Scrums 0/0 (0 %) 0/0 (0 %)
Lineouts 1/1 (100 %) 0/0 (0 %)
Offloads / Passes 2/33 (6 %) 5/22 (23 %)
Handling Errors 0/33 (0 %) 2/22 (9 %)

Referee – James Doleman

Paris 2017 – Argentina v USA Stats

Team ARG USA
Score 19 26
Possessions / Opportunities 5/9 (56 %) 7/9 (78 %)
Tries / Possessions 3/5 (60 %) 4/7 (57 %)
Conversions 2/3 (67 %) 3/4 (75 %)
DGs and PKs 0/0 (0 %) 0/0 (0 %)
Receiving Kickoffs 1/5 (20 %) 3/4 (75 %)
Kickoffs 1/4 (25 %) 4/5 (80 %)
Meters / Possible 161/448 (36 %) 134/621 (22 %)
Running Meters 104 100
Kicking Meters 57 34
Breaks 1 3
Half Breaks 4 1
Penalties Conceded 0 2
Yellow Cards 0 0
Red Cards 0 0
Tackles 15 15
Contact Successes 2/24 (8 %) 1/21 (5 %)
Contact Failures 5/24 (21 %) 6/21 (29 %)
Rucks 11/11 (100 %) 10/11 (91 %)
Scrums 0/0 (0 %) 1/1 (100 %)
Lineouts 1/1 (100 %) 0/1 (0 %)
Offloads / Passes 4/28 (14 %) 5/37 (14 %)
Handling Errors 2/28 (7 %) 0/37 (0 %)

Referee – Pierre Brousset

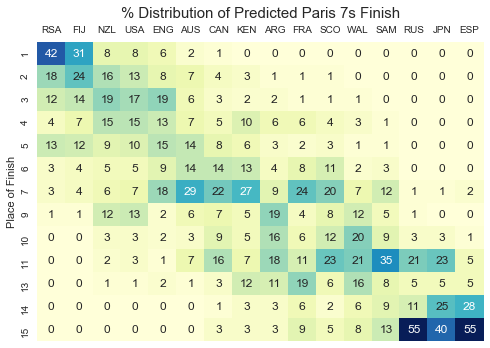
Paris 2017 Predictions

I’ve added some recency to the predictions here, weighting Hong Kong and Singapore results more heavily than other tournaments. But I still lack adjustments for personnel. So a team like England, who played much of Hong Kong and Singapore without captain Tom Mitchell, may be overly hurt by the recency adjustment considering Mitchell is back for Paris.

Pool A

Even considering Canada’s surprise victory in Singapore, they’ll still be heavy underdogs against South Africa who can clinch the series title this weekend. Scotland has leveled off into an average series team but has a good shot at getting back to their first quarter-finals since Wellington.

Team Pool Win % Quarter-Final %
South Africa 86 % 97 %
Canada 11 % 58 %
Scotland 3 % 43 %
Japan < 1 % 3 %

Pool B

This pool is loaded and should create some exciting matches. Some of the best USA games this year have come against both New Zealand and Argentina. I’m always on the lookout for NZ missing their first quarter-final ever and there’s a reasonable chance it occurs this weekend. The USA versus New Zealand match has ramifications on the overall series standings where the Eagles could still pass NZ for fourth.

Team Pool Win % Quarter-Final %
New Zealand 47 % 82 %
USA 42 % 77 %
Argentina 8 % 28 %
Wales 4 % 14 %

Pool C

As mentioned above, England wasn’t up to their best in Hong Kong and Singapore and thus, the numbers are a bit lower than expected. Kenya will look for revenge from that wild Singapore quarter-final. France and Hong Kong qualifier winners Spain are both excellent at restarts, an area of weakness for Kenya. France performed well at their home tournament last year and is 1-0 against England so far this season.

Team Pool Win % Quarter-Final %
England 70 % 92 %
Kenya 20 % 63 %
France 10 % 42 %
Spain < 1 % 4 %

Pool D

Over the last two tournaments Fiji has performed the best. They should see competition from Australia and a match with Samoa could get physical, but the Fijians should roll to a favorable quarter-final versus Canada or Scotland. We’ve seen some improvements from Samoa but they struggled in both Hong Kong and Singapore.

Team Pool Win % Quarter-Final %
Fiji 82 % 98 %
Australia 17 % 82 %
Samoa 1 % 18 %
Russia < 1 % 2 %

Tournament Finish

Despite the emphasis on recent tournaments, South Africa is still favored, though their advantage over Fiji is narrow. They are both positioned to avoid each other until the final, a match we would all surely enjoy.

Keep in mind that since 7th, 11th, and 15th places don’t have a playoff decider, those rows in the image below total to 200%. These finishes effectively absorb the 100% from finishes 8th, 12th, and 16th that don’t get decided. For example, while Australia’s most likely finish is 7th, after a 5th-place semifinal loss, it’s roughly as likely they win that 5th-place semifinal. After which, their finish is distributed between 5th or 6th places.
Singapore 2017 Stats

Adjusted Rates

Team Adj Try Rate Opponent Adj Try Rate Adj Gather Rate Opponent Adj Gather Rate Adj Margin
Fiji 0.49 0.21 0.90 0.78 15.54
USA 0.65 0.45 0.86 0.68 13.88
Canada 0.51 0.38 1.00 0.79 10.59
New Zealand 0.51 0.35 0.94 0.72 10.23
South Africa 0.50 0.32 0.91 0.90 8.40
Australia 0.54 0.33 0.80 0.93 6.81
Kenya 0.37 0.32 0.91 0.85 3.48
England 0.35 0.34 0.85 0.83 1.19
Scotland 0.46 0.49 0.94 0.92 0.38
Wales 0.39 0.42 0.87 0.91 -1.63
Argentina 0.37 0.44 0.91 0.88 -3.36
France 0.33 0.39 0.74 0.92 -4.56
Samoa 0.32 0.43 0.69 0.90 -7.40
Russia 0.38 0.64 0.71 0.85 -17.00
Hong Kong 0.26 0.67 0.79 0.86 -20.15
Japan 0.32 0.69 0.73 0.93 -21.82

Possession

Team Games Opps Opp Rate Gathers Gather Rate
Argentina 6 51 8.50 48 0.94
Australia 6 44 7.33 35 0.80
Canada 6 44 7.33 42 0.95
England 6 52 8.67 46 0.88
Fiji 5 45 9.00 39 0.87
France 5 46 9.20 36 0.78
Hong Kong 5 37 7.40 29 0.78
Japan 5 41 8.20 31 0.76
Kenya 5 43 8.60 39 0.91
New Zealand 6 50 8.33 46 0.92
South Africa 6 46 7.67 42 0.91
Russia 6 51 8.50 37 0.73
Samoa 5 39 7.80 29 0.74
Scotland 6 49 8.17 45 0.92
USA 6 51 8.50 43 0.84
Wales 6 48 8.00 41 0.85

Scoring

Team Tries Try Rate Con Atmpts Cons Con Rate
Argentina 20 0.42 19 13 0.68
Australia 17 0.49 17 11 0.65
Canada 22 0.52 22 13 0.59
England 16 0.35 16 10 0.62
Fiji 22 0.56 22 19 0.86
France 12 0.33 12 10 0.83
Hong Kong 8 0.28 8 4 0.50
Japan 10 0.32 10 8 0.80
Kenya 13 0.33 13 7 0.54
New Zealand 22 0.48 22 12 0.55
South Africa 20 0.48 19 11 0.58
Russia 16 0.43 16 8 0.50
Samoa 10 0.34 10 8 0.80
Scotland 21 0.47 21 15 0.71
USA 25 0.58 25 20 0.80
Wales 18 0.44 18 14 0.78

Opponent Possession

Team Games Opponent Opps Opponent Opp Rate Opponent Gathers Opponent Gather Rate
Argentina 6 51 8.50 41 0.80
Australia 6 45 7.50 42 0.93
Canada 6 42 7.00 33 0.79
England 6 51 8.50 42 0.82
Fiji 5 44 8.80 35 0.80
France 5 47 9.40 44 0.94
Hong Kong 5 39 7.80 35 0.90
Japan 5 43 8.60 37 0.86
Kenya 5 46 9.20 39 0.85
New Zealand 6 52 8.67 41 0.79
South Africa 6 44 7.33 38 0.86
Russia 6 50 8.33 43 0.86
Samoa 5 39 7.80 35 0.90
Scotland 6 48 8.00 44 0.92
USA 6 48 8.00 36 0.75
Wales 6 48 8.00 43 0.90

Opponent Scoring

Team Opponent Tries Opponent Try Rate Opponent Con Atmpts Opponent Cons Opponent Con Rate
Argentina 16 0.39 16 11 0.69
Australia 15 0.36 15 11 0.73
Canada 14 0.42 14 9 0.64
England 14 0.33 13 7 0.54
Fiji 9 0.26 9 5 0.56
France 16 0.36 15 9 0.60
Hong Kong 24 0.69 24 16 0.67
Japan 24 0.65 24 18 0.75
Kenya 13 0.33 13 6 0.46
New Zealand 16 0.39 16 14 0.88
South Africa 12 0.32 12 7 0.58
Russia 26 0.60 26 22 0.85
Samoa 14 0.40 14 8 0.57
Scotland 21 0.48 21 12 0.57
USA 18 0.50 18 14 0.78
Wales 20 0.47 20 14 0.70

Offensive Meters

Team Kicking Meters Running Meters Total Meters Max. Possible Meters % of Max Gained
Argentina 337 1310 1647 2918 56.4%
Australia 309 1191 1500 2877 52.1%
Canada 285 1520 1805 2668 67.7%
England 310 1156 1466 2967 49.4%
Fiji 238 1467 1705 2614 65.2%
France 620 975 1595 2901 55.0%
Hong Kong 336 621 957 2662 36.0%
Japan 321 777 1098 2652 41.4%
Kenya 178 1246 1424 2649 53.8%
New Zealand 107 1537 1644 2879 57.1%
South Africa 369 1225 1594 2893 55.1%
Russia 211 1354 1565 3164 49.5%
Samoa 290 866 1156 2671 43.3%
Scotland 371 1562 1933 3049 63.4%
USA 171 1455 1626 2971 54.7%
Wales 205 1587 1792 3289 54.5%

Defensive Meters

Team Kicking Meters Running Meters Total Meters Max. Possible Meters % of Max Gained
Argentina 285 1179 1464 3382 43.3%
Australia 227 1057 1284 2671 48.1%
Canada 216 1231 1447 2717 53.3%
England 241 1124 1365 3252 42.0%
Fiji 392 828 1220 2686 45.4%
France 289 1451 1740 3129 55.6%
Hong Kong 287 1325 1612 2178 74.0%
Japan 125 1387 1512 2366 63.9%
Kenya 413 1067 1480 2849 51.9%
New Zealand 229 1305 1534 3270 46.9%
South Africa 483 905 1388 2875 48.3%
Russia 362 1463 1825 3110 58.7%
Samoa 209 1188 1397 2206 63.3%
Scotland 439 1473 1912 3233 59.1%
USA 149 1240 1389 2905 47.8%
Wales 312 1626 1938 2995 64.7%

Receiving Kickoffs

Team Kickoffs Opp KO Errors Wins (w/o Errors) Win % (w/o Errors)
Argentina 19 3 13 81.2%
Australia 19 0 12 63.2%
Canada 16 4 11 91.7%
England 17 0 13 76.5%
Fiji 12 2 4 40.0%
France 18 1 11 64.7%
Hong Kong 24 2 15 68.2%
Japan 22 0 16 72.7%
Kenya 12 1 8 72.7%
New Zealand 18 0 14 77.8%
South Africa 16 0 14 87.5%
Russia 28 1 15 55.6%
Samoa 17 0 8 47.1%
Scotland 23 2 17 81.0%
USA 20 2 15 83.3%
Wales 23 2 16 76.2%

Kickoffs

Team Kickoffs Errors Wins Win % (w/ Errors)
Argentina 21 0 7 33.3
Australia 19 1 3 15.8
Canada 23 1 7 30.4
England 19 0 7 36.8
Fiji 22 4 6 27.3
France 16 1 2 12.5
Hong Kong 12 1 4 33.3
Japan 13 0 4 30.8
Kenya 16 2 6 37.5
New Zealand 23 3 6 26.1
South Africa 22 2 5 22.7
Russia 18 2 4 22.2
Samoa 13 0 1 7.7
Scotland 21 0 3 14.3
USA 26 0 12 46.2
Wales 20 3 5 25.0

Defensive Contact

Team Contact Opps D Successes D Success Rate D Failures D Fail Rate
Argentina 127 18 14.2% 33 26.0%
Australia 156 18 11.5% 49 31.4%
Canada 119 13 10.9% 29 24.4%
England 110 14 12.7% 38 34.5%
Fiji 129 16 12.4% 39 30.2%
France 129 16 12.4% 46 35.7%
Hong Kong 107 5 4.7% 43 40.2%
Japan 148 11 7.4% 58 39.2%
Kenya 96 9 9.4% 29 30.2%
New Zealand 163 18 11.0% 45 27.6%
South Africa 104 16 15.4% 26 25.0%
Russia 101 9 8.9% 33 32.7%
Samoa 122 14 11.5% 43 35.2%
Scotland 119 11 9.2% 37 31.1%
USA 111 15 13.5% 37 33.3%
Wales 108 13 12.0% 33 30.6%

Offensive Contact

Team Contact Opps D Successes D Success Rate D Failures D Fail Rate
Argentina 125 16 12.8% 33 26.4%
Australia 111 8 7.2% 43 38.7%
Canada 141 13 9.2% 45 31.9%
England 134 18 13.4% 40 29.9%
Fiji 102 11 10.8% 32 31.4%
France 105 12 11.4% 35 33.3%
Hong Kong 103 10 9.7% 25 24.3%
Japan 103 11 10.7% 32 31.1%
Kenya 108 16 14.8% 35 32.4%
New Zealand 122 17 13.9% 40 32.8%
South Africa 127 16 12.6% 49 38.6%
Russia 124 15 12.1% 38 30.6%
Samoa 115 10 8.7% 28 24.3%
Scotland 153 17 11.1% 47 30.7%
USA 138 12 8.7% 49 35.5%
Wales 138 14 10.1% 47 34.1%

Breaks

Team Breaks Half Breaks Opponent Breaks Opponent Half Breaks
Argentina 18 10 20 9
Australia 16 9 17 19
Canada 26 19 14 12
England 26 17 14 10
Fiji 19 7 11 13
France 19 10 18 15
Hong Kong 8 10 20 17
Japan 9 10 19 17
Kenya 15 12 13 7
New Zealand 21 17 14 19
South Africa 16 15 15 6
Russia 15 16 23 12
Samoa 12 7 17 11
Scotland 16 19 24 10
USA 21 10 20 18
Wales 22 17 20 10

Penalties and Cards

Team Penalties Against Yellow Cards Red Cards Opponent Penalties Opponent Yellow Cards Opponent Red Cards
Argentina 13 1 0 22 4 0
Australia 16 1 0 20 2 0
Canada 12 1 0 14 3 0
England 23 1 0 17 1 0
Fiji 11 4 1 9 0 0
France 13 2 0 11 2 0
Hong Kong 19 0 0 10 1 0
Japan 11 0 0 9 0 0
Kenya 18 2 0 16 4 0
New Zealand 25 2 0 11 1 0
South Africa 14 2 0 16 0 1
Russia 18 4 0 14 1 0
Samoa 15 3 0 12 0 0
Scotland 8 1 0 24 3 0
USA 6 0 0 13 0 0
Wales 15 1 0 19 1 0

Offensive Passing

Team Passes Offloads Offload Rate Errors Err Rate
Argentina 190 17 8.9% 13 6.8%
Australia 179 19 10.6% 8 4.5%
Canada 255 31 12.2% 10 3.9%
England 298 33 11.1% 15 5.0%
Fiji 136 44 32.4% 11 8.1%
France 164 27 16.5% 13 7.9%
Hong Kong 186 16 8.6% 9 4.8%
Japan 183 32 17.5% 10 5.5%
Kenya 147 28 19.0% 15 10.2%
New Zealand 241 28 11.6% 10 4.1%
South Africa 181 12 6.6% 7 3.9%
Russia 186 23 12.4% 12 6.5%
Samoa 159 9 5.7% 7 4.4%
Scotland 233 37 15.9% 9 3.9%
USA 259 37 14.3% 13 5.0%
Wales 257 36 14.0% 17 6.6%

Defensive Passing

Team Passes Offloads Offload Rate Errors Err Rate
Argentina 155 30 19.4% 9 5.8%
Australia 256 32 12.5% 12 4.7%
Canada 176 33 18.8% 12 6.8%
England 195 18 9.2% 16 8.2%
Fiji 225 27 12.0% 13 5.8%
France 193 42 21.8% 10 5.2%
Hong Kong 190 25 13.2% 8 4.2%
Japan 230 25 10.9% 7 3.0%
Kenya 208 15 7.2% 7 3.4%
New Zealand 254 41 16.1% 17 6.7%
South Africa 165 24 14.5% 12 7.3%
Russia 205 25 12.2% 12 5.9%
Samoa 195 23 11.8% 11 5.6%
Scotland 207 25 12.1% 13 6.3%
USA 194 30 15.5% 10 5.2%
Wales 206 14 6.8% 10 4.9%

Rucks

Team Rucks Wins Win % Opp Rucks Wins Win %
Argentina 66 64 97.0% 66 11 16.7%
Australia 56 53 94.6% 79 5 6.3%
Canada 71 65 91.5% 56 4 7.1%
England 65 58 89.2% 59 6 10.2%
Fiji 28 25 89.3% 62 7 11.3%
France 44 39 88.6% 49 6 12.2%
Hong Kong 66 59 89.4% 45 0 0.0%
Japan 44 38 86.4% 71 3 4.2%
Kenya 43 39 90.7% 51 3 5.9%
New Zealand 56 51 91.1% 79 7 8.9%
South Africa 65 58 89.2% 53 10 18.9%
Russia 65 58 89.2% 51 4 7.8%
Samoa 79 73 92.4% 50 4 8.0%
Scotland 72 64 88.9% 52 4 7.7%
USA 50 47 94.0% 43 3 7.0%
Wales 55 51 92.7% 59 6 10.2%

Scrums

Team Scrums Wins Win % Opp Scrums Wins Win %
Argentina 7 7 100.0% 11 0 0.0%
Australia 11 11 100.0% 7 0 0.0%
Canada 7 7 100.0% 4 0 0.0%
England 10 10 100.0% 12 0 0.0%
Fiji 5 5 100.0% 5 0 0.0%
France 5 5 100.0% 7 0 0.0%
Hong Kong 3 3 100.0% 5 0 0.0%
Japan 8 8 100.0% 5 0 0.0%
Kenya 6 6 100.0% 14 0 0.0%
New Zealand 5 5 100.0% 5 1 20.0%
South Africa 11 10 90.9% 5 0 0.0%
Russia 10 10 100.0% 4 0 0.0%
Samoa 10 10 100.0% 10 0 0.0%
Scotland 4 4 100.0% 6 0 0.0%
USA 8 8 100.0% 6 0 0.0%
Wales 7 7 100.0% 11 0 0.0%

Lineouts

Team Lineouts Wins Win % Opp Lineouts Wins Win %
Argentina 5 5 100.0% 8 3 37.5%
Australia 9 7 77.8% 5 1 20.0%
Canada 7 7 100.0% 8 3 37.5%
England 10 8 80.0% 8 2 25.0%
Fiji 2 2 100.0% 8 1 12.5%
France 9 7 77.8% 5 2 40.0%
Hong Kong 6 4 66.7% 4 0 0.0%
Japan 8 4 50.0% 4 1 25.0%
Kenya 4 1 25.0% 5 2 40.0%
New Zealand 5 4 80.0% 12 3 25.0%
South Africa 9 8 88.9% 12 1 8.3%
Russia 3 1 33.3% 9 1 11.1%
Samoa 7 5 71.4% 4 3 75.0%
Scotland 11 10 90.9% 5 1 20.0%
USA 5 2 40.0% 2 0 0.0%
Wales 6 5 83.3% 7 2 28.6%

Singapore 2017 – Canada v USA Stats

Team CAN USA
Score 26 19
Possessions / Opportunities 7/7 (100 %) 7/8 (88 %)
Tries / Possessions 4/7 (57 %) 3/7 (43 %)
Conversions 3/4 (75 %) 2/3 (67 %)
DGs and PKs 0/0 (0 %) 0/0 (0 %)
Receiving Kickoffs 3/3 (100 %) 4/5 (80 %)
Kickoffs 1/5 (20 %) 0/3 (0 %)
Meters / Possible 263/484 (54 %) 248/458 (54 %)
Running Meters 244 193
Kicking Meters 19 55
Breaks 3 1
Half Breaks 3 0
Penalties Conceded 3 0
Yellow Cards 0 0
Red Cards 0 0
Tackles 8 14
Contact Successes 2/18 (11 %) 3/23 (13 %)
Contact Failures 5/18 (28 %) 8/23 (35 %)
Rucks 7/9 (78 %) 6/6 (100 %)
Scrums 1/1 (100 %) 2/2 (100 %)
Lineouts 0/0 (0 %) 0/0 (0 %)
Offloads / Passes 5/40 (12 %) 4/19 (21 %)
Handling Errors 2/40 (5 %) 3/19 (16 %)

Referee – Jordan Way