With some suggestions from Jacob Liberman I’ve updated how I track contact success and failure. You may have noticed this in the stats I recently posted for Vancouver. At some point I will likely update the stats from previous tournaments as well.
The old method considered all made tackles as “contact successes” while lumping missed tackles and offloads together as “contact failures”. First, I never liked that offloads were coded as failures. I don’t believe offloads are inherently successful. Success is determined by the result of the offload; Did it create a break? Did it result in a turnover? This outcome-based classification should also apply to made tackles. Missing a tackle is bad, creating a turnover is good, and making a tackle is just something you do to prevent a missed tackle and create the opportunity for a turnover. As these shortcomings suggest, the old method was unsatisfactory in identifying the success of teams in contact situations.
Now made tackles that don’t result in a turnover and completed offloads that don’t result in a turnover or a break are considered “neutral events”, neither success nor failure. Given that turnovers and breaks are relatively uncommon, most teams will have a large portion of their contact situations classified as neutral. Missed tackles, half-breaks, breaks, and especially turnovers are the significant moments in a possession. The new method classifies these events accordingly.
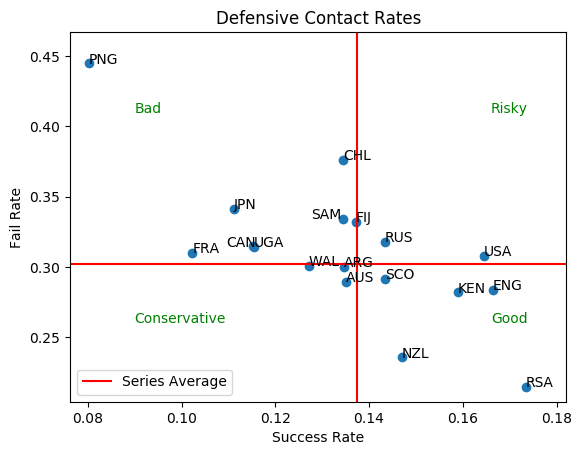
To help illustrate the change, I included a chart that plots contact success rate and contact failure rate by team through the Vancouver tournament. It’s a first stab at determining whether the new method is useful for identifying teams strong or weak in contact. The rates seem to not only identify differences in teams but do so in a way that correlates with other important defensive metrics like opposition try rate, opposition breaks, and opposition meters. Considering how a large portion of defense is based on contact, this is encouraging.
There is certainly more to be learned from contact success and failure. But tracking those situations according to their outcomes – and, in doing so, describing more precisely which teams are “good at contact” – should provide a better foundation for answering future questions.
