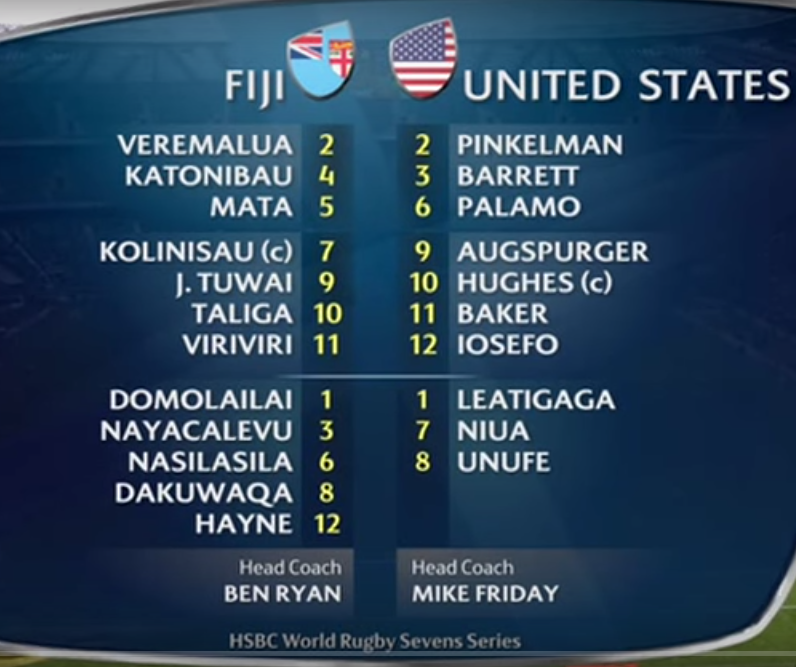
Here are my standard stats tables for the Wellington round of the HSBC Sevens World Series.
Adjusted Rates
| Team | Adj Try Rate | Opponent Adj Try Rate | Adj Gather Rate | Opponent Adj Gather Rate | Adj Margin |
|---|---|---|---|---|---|
| South Africa | 0.60 | 0.05 | 1.00 | 0.89 | 32.01 |
| Fiji | 0.49 | 0.21 | 0.94 | 0.79 | 17.19 |
| Canada | 0.57 | 0.34 | 0.97 | 0.74 | 15.06 |
| New Zealand | 0.42 | 0.30 | 0.99 | 0.82 | 9.04 |
| Scotland | 0.45 | 0.29 | 0.94 | 0.89 | 8.68 |
| England | 0.36 | 0.30 | 0.92 | 0.72 | 7.00 |
| Argentina | 0.37 | 0.34 | 0.92 | 0.94 | 0.59 |
| Australia | 0.39 | 0.37 | 0.85 | 0.86 | 0.08 |
| Kenya | 0.36 | 0.41 | 0.87 | 0.91 | -1.74 |
| France | 0.34 | 0.46 | 0.80 | 0.84 | -5.76 |
| USA | 0.29 | 0.40 | 0.86 | 0.92 | -6.45 |
| Wales | 0.31 | 0.39 | 0.80 | 0.92 | -7.47 |
| Samoa | 0.27 | 0.53 | 0.81 | 0.88 | -13.22 |
| Russia | 0.12 | 0.45 | 0.85 | 0.94 | -17.76 |
| Japan | 0.23 | 0.54 | 0.84 | 0.97 | -18.32 |
| Papua New Guinea | 0.13 | 0.66 | 0.65 | 0.97 | -29.76 |
Possession
| Team | Games | Opps | Opp Rate | Gathers | Gather Rate |
|---|---|---|---|---|---|
| Argentina | 6 | 48 | 8.00 | 44 | 0.92 |
| Australia | 6 | 52 | 8.67 | 45 | 0.87 |
| Canada | 6 | 42 | 7.00 | 41 | 0.98 |
| England | 5 | 43 | 8.60 | 41 | 0.95 |
| Fiji | 6 | 56 | 9.33 | 53 | 0.95 |
| France | 5 | 42 | 8.40 | 34 | 0.81 |
| Japan | 5 | 44 | 8.80 | 37 | 0.84 |
| Kenya | 6 | 55 | 9.17 | 49 | 0.89 |
| New Zealand | 6 | 50 | 8.33 | 48 | 0.96 |
| Papua New Guinea | 5 | 47 | 9.40 | 31 | 0.66 |
| South Africa | 6 | 49 | 8.17 | 48 | 0.98 |
| Russia | 6 | 48 | 8.00 | 41 | 0.85 |
| Samoa | 6 | 47 | 7.83 | 39 | 0.83 |
| Scotland | 6 | 49 | 8.17 | 43 | 0.88 |
| USA | 5 | 44 | 8.80 | 38 | 0.86 |
| Wales | 5 | 44 | 8.80 | 36 | 0.82 |
Scoring
| Team | Tries | Try Rate | Con Atmpts | Cons | Con Rate |
|---|---|---|---|---|---|
| Argentina | 19 | 0.43 | 19 | 10 | 0.53 |
| Australia | 17 | 0.38 | 17 | 9 | 0.53 |
| Canada | 21 | 0.51 | 21 | 12 | 0.57 |
| England | 17 | 0.41 | 16 | 12 | 0.75 |
| Fiji | 22 | 0.42 | 22 | 17 | 0.77 |
| France | 11 | 0.32 | 11 | 11 | 1.00 |
| Japan | 5 | 0.14 | 4 | 3 | 0.75 |
| Kenya | 21 | 0.43 | 21 | 14 | 0.67 |
| New Zealand | 20 | 0.42 | 20 | 13 | 0.65 |
| Papua New Guinea | 5 | 0.16 | 5 | 4 | 0.80 |
| South Africa | 28 | 0.58 | 28 | 22 | 0.79 |
| Russia | 7 | 0.17 | 7 | 1 | 0.14 |
| Samoa | 14 | 0.36 | 14 | 11 | 0.79 |
| Scotland | 18 | 0.42 | 18 | 13 | 0.72 |
| USA | 14 | 0.37 | 14 | 9 | 0.64 |
| Wales | 14 | 0.39 | 14 | 7 | 0.50 |
Opponent Possession
| Team | Games | Opponent Opps | Opponent Opp Rate | Opponent Gathers | Opponent Gather Rate |
|---|---|---|---|---|---|
| Argentina | 6 | 45 | 7.50 | 41 | 0.91 |
| Australia | 6 | 51 | 8.50 | 44 | 0.86 |
| Canada | 6 | 43 | 7.17 | 34 | 0.79 |
| England | 5 | 40 | 8.00 | 29 | 0.72 |
| Fiji | 6 | 56 | 9.33 | 48 | 0.86 |
| France | 5 | 39 | 7.80 | 34 | 0.87 |
| Japan | 5 | 43 | 8.60 | 43 | 1.00 |
| Kenya | 6 | 53 | 8.83 | 46 | 0.87 |
| New Zealand | 6 | 50 | 8.33 | 41 | 0.82 |
| Papua New Guinea | 5 | 50 | 10.00 | 48 | 0.96 |
| South Africa | 6 | 49 | 8.17 | 44 | 0.90 |
| Russia | 6 | 48 | 8.00 | 45 | 0.94 |
| Samoa | 6 | 51 | 8.50 | 42 | 0.82 |
| Scotland | 6 | 50 | 8.33 | 46 | 0.92 |
| USA | 5 | 43 | 8.60 | 39 | 0.91 |
| Wales | 5 | 43 | 8.60 | 38 | 0.88 |
Opponent Scoring
| Team | Opponent Tries | Opponent Try Rate | Opponent Con Atmpts | Opponent Cons | Opponent Con Rate |
|---|---|---|---|---|---|
| Argentina | 12 | 0.29 | 12 | 9 | 0.75 |
| Australia | 17 | 0.39 | 17 | 12 | 0.71 |
| Canada | 14 | 0.41 | 14 | 10 | 0.71 |
| England | 9 | 0.31 | 9 | 6 | 0.67 |
| Fiji | 15 | 0.31 | 15 | 9 | 0.60 |
| France | 17 | 0.50 | 17 | 14 | 0.82 |
| Japan | 24 | 0.56 | 24 | 18 | 0.75 |
| Kenya | 15 | 0.33 | 15 | 6 | 0.40 |
| New Zealand | 12 | 0.29 | 12 | 8 | 0.67 |
| Papua New Guinea | 30 | 0.62 | 30 | 21 | 0.70 |
| South Africa | 4 | 0.09 | 4 | 1 | 0.25 |
| Russia | 20 | 0.44 | 19 | 11 | 0.58 |
| Samoa | 19 | 0.45 | 19 | 13 | 0.68 |
| Scotland | 15 | 0.33 | 14 | 9 | 0.64 |
| USA | 14 | 0.36 | 14 | 10 | 0.71 |
| Wales | 14 | 0.37 | 14 | 10 | 0.71 |
Passing
| Team | Passes | Errors | Err Rate | Opponent Passes | Opponent Errors | Opponent Err Rate |
|---|---|---|---|---|---|---|
| Argentina | 223 | 14.0 | 6.3% | 190 | 11.0 | 5.8% |
| Australia | 212 | 13.0 | 6.1% | 211 | 15.0 | 7.1% |
| Canada | 250 | 8.0 | 3.2% | 156 | 7.0 | 4.5% |
| England | 255 | 11.0 | 4.3% | 172 | 8.0 | 4.7% |
| Fiji | 192 | 13.0 | 6.8% | 195 | 22.0 | 11.3% |
| France | 160 | 10.0 | 6.2% | 117 | 10.0 | 8.5% |
| Japan | 173 | 13.0 | 7.5% | 177 | 7.0 | 4.0% |
| Kenya | 231 | 16.0 | 6.9% | 209 | 14.0 | 6.7% |
| New Zealand | 260 | 14.0 | 5.4% | 197 | 16.0 | 8.1% |
| Papua New Guinea | 145 | 14.0 | 9.7% | 254 | 12.0 | 4.7% |
| South Africa | 141 | 9.0 | 6.4% | 197 | 14.0 | 7.1% |
| Russia | 219 | 16.0 | 7.3% | 249 | 13.0 | 5.2% |
| Samoa | 157 | 11.0 | 7.0% | 279 | 15.0 | 5.4% |
| Scotland | 258 | 7.0 | 2.7% | 268 | 15.0 | 5.6% |
| USA | 199 | 16.0 | 8.0% | 163 | 8.0 | 4.9% |
| Wales | 201 | 16.0 | 8.0% | 202 | 11.0 | 5.4% |
Penalties and Cards
| Team | Penalties Against | Yellow Cards | Red Cards | Opponent Penalties | Opponent Yellow Cards | Opponent Red Cards |
|---|---|---|---|---|---|---|
| Argentina | 15 | 2 | 0 | 22 | 0 | 0 |
| Australia | 18 | 0 | 0 | 29 | 3 | 0 |
| Canada | 21 | 0 | 0 | 18 | 1 | 0 |
| England | 19 | 0 | 0 | 12 | 1 | 0 |
| Fiji | 17 | 3 | 0 | 15 | 0 | 0 |
| France | 14 | 0 | 0 | 9 | 1 | 0 |
| Japan | 17 | 1 | 0 | 20 | 1 | 0 |
| Kenya | 22 | 1 | 0 | 14 | 0 | 0 |
| New Zealand | 17 | 1 | 0 | 19 | 2 | 0 |
| Papua New Guinea | 9 | 1 | 0 | 15 | 2 | 0 |
| South Africa | 20 | 0 | 0 | 21 | 2 | 0 |
| Russia | 22 | 2 | 0 | 19 | 1 | 0 |
| Samoa | 23 | 6 | 0 | 17 | 0 | 0 |
| Scotland | 13 | 1 | 0 | 19 | 3 | 0 |
| USA | 16 | 1 | 0 | 17 | 2 | 0 |
| Wales | 10 | 0 | 0 | 11 | 0 | 0 |
Defensive Contact
| Team | Contact Opps | D Successes | D Failures | Offloads | D Success Rate |
|---|---|---|---|---|---|
| Argentina | 110 | 63 | 27 | 20 | 57.3% |
| Australia | 170 | 99 | 38 | 33 | 58.2% |
| Canada | 95 | 59 | 20 | 16 | 62.1% |
| England | 98 | 59 | 23 | 16 | 60.2% |
| Fiji | 119 | 62 | 33 | 24 | 52.1% |
| France | 85 | 48 | 22 | 15 | 56.5% |
| Japan | 102 | 60 | 30 | 12 | 58.8% |
| Kenya | 109 | 73 | 18 | 18 | 67.0% |
| New Zealand | 121 | 73 | 23 | 25 | 60.3% |
| Papua New Guinea | 152 | 59 | 60 | 33 | 38.8% |
| South Africa | 163 | 109 | 30 | 24 | 66.9% |
| Russia | 139 | 75 | 31 | 33 | 54.0% |
| Samoa | 152 | 76 | 44 | 32 | 50.0% |
| Scotland | 139 | 96 | 23 | 20 | 69.1% |
| USA | 102 | 58 | 20 | 24 | 56.9% |
| Wales | 107 | 68 | 18 | 21 | 63.6% |
Offensive Contact
| Team | Contact Opps | D Successes | D Failures | Offloads | D Success Rate |
|---|---|---|---|---|---|
| Argentina | 151 | 87 | 43 | 21 | 57.6% |
| Australia | 130 | 81 | 33 | 16 | 62.3% |
| Canada | 160 | 101 | 33 | 26 | 63.1% |
| England | 99 | 54 | 29 | 16 | 54.5% |
| Fiji | 131 | 70 | 25 | 36 | 53.4% |
| France | 128 | 83 | 29 | 16 | 64.8% |
| Japan | 112 | 71 | 13 | 28 | 63.4% |
| Kenya | 152 | 82 | 41 | 29 | 53.9% |
| New Zealand | 138 | 76 | 35 | 27 | 55.1% |
| Papua New Guinea | 81 | 48 | 16 | 17 | 59.3% |
| South Africa | 89 | 49 | 28 | 12 | 55.1% |
| Russia | 151 | 112 | 26 | 13 | 74.2% |
| Samoa | 132 | 75 | 41 | 16 | 56.8% |
| Scotland | 116 | 63 | 25 | 28 | 54.3% |
| USA | 110 | 51 | 24 | 35 | 46.4% |
| Wales | 107 | 48 | 27 | 32 | 44.9% |
Scrums
| Team | Scrums | Wins | Win % | Opp Scrums | Wins | Win % |
|---|---|---|---|---|---|---|
| Argentina | 3 | 2 | 66.7% | 7 | 0 | 0.0% |
| Australia | 8 | 8 | 100.0% | 10 | 0 | 0.0% |
| Canada | 7 | 6 | 85.7% | 11 | 0 | 0.0% |
| England | 5 | 5 | 100.0% | 4 | 1 | 25.0% |
| Fiji | 15 | 15 | 100.0% | 9 | 1 | 11.1% |
| France | 6 | 6 | 100.0% | 7 | 0 | 0.0% |
| Japan | 8 | 8 | 100.0% | 7 | 0 | 0.0% |
| Kenya | 9 | 9 | 100.0% | 7 | 0 | 0.0% |
| New Zealand | 12 | 12 | 100.0% | 9 | 0 | 0.0% |
| Papua New Guinea | 10 | 8 | 80.0% | 6 | 0 | 0.0% |
| South Africa | 8 | 8 | 100.0% | 7 | 0 | 0.0% |
| Russia | 12 | 11 | 91.7% | 13 | 1 | 7.7% |
| Samoa | 7 | 6 | 85.7% | 6 | 1 | 16.7% |
| Scotland | 10 | 9 | 90.0% | 8 | 1 | 12.5% |
| USA | 1 | 1 | 100.0% | 9 | 0 | 0.0% |
| Wales | 10 | 10 | 100.0% | 10 | 2 | 20.0% |
Lineouts
| Team | Lineouts | Wins | Win % | Opp Lineouts | Wins | Win % |
|---|---|---|---|---|---|---|
| Argentina | 5 | 5 | 100.0% | 5 | 0 | 0.0% |
| Australia | 12 | 9 | 75.0% | 4 | 2 | 50.0% |
| Canada | 10 | 10 | 100.0% | 3 | 1 | 33.3% |
| England | 10 | 10 | 100.0% | 8 | 1 | 12.5% |
| Fiji | 6 | 6 | 100.0% | 6 | 0 | 0.0% |
| France | 6 | 4 | 66.7% | 7 | 2 | 28.6% |
| Japan | 10 | 5 | 50.0% | 8 | 0 | 0.0% |
| Kenya | 3 | 3 | 100.0% | 7 | 2 | 28.6% |
| New Zealand | 8 | 8 | 100.0% | 2 | 1 | 50.0% |
| Papua New Guinea | 3 | 0 | 0.0% | 4 | 0 | 0.0% |
| South Africa | 5 | 5 | 100.0% | 13 | 3 | 23.1% |
| Russia | 2 | 2 | 100.0% | 6 | 1 | 16.7% |
| Samoa | 6 | 3 | 50.0% | 10 | 4 | 40.0% |
| Scotland | 5 | 3 | 60.0% | 7 | 0 | 0.0% |
| USA | 8 | 7 | 87.5% | 6 | 1 | 16.7% |
| Wales | 3 | 3 | 100.0% | 6 | 1 | 16.7% |
Receiving Kickoffs
| Team | Kickoffs | Opp KO Errors | Wins (w/o Errors) | Win % (w/o Errors) |
|---|---|---|---|---|
| Argentina | 18 | 2 | 13 | 81.2% |
| Australia | 20 | 2 | 12 | 66.7% |
| Canada | 15 | 0 | 15 | 100.0% |
| England | 11 | 1 | 8 | 80.0% |
| Fiji | 16 | 2 | 11 | 78.6% |
| France | 21 | 2 | 12 | 63.2% |
| Japan | 25 | 0 | 21 | 84.0% |
| Kenya | 18 | 1 | 11 | 64.7% |
| New Zealand | 15 | 1 | 12 | 85.7% |
| Papua New Guinea | 29 | 3 | 14 | 53.8% |
| South Africa | 10 | 0 | 9 | 90.0% |
| Russia | 23 | 0 | 18 | 78.3% |
| Samoa | 19 | 1 | 13 | 72.2% |
| Scotland | 18 | 0 | 13 | 72.2% |
| USA | 16 | 2 | 9 | 64.3% |
| Wales | 16 | 0 | 9 | 56.2% |
Kickoffs
| Team | Kickoffs | Errors | Wins | Win % (w/ Errors) |
|---|---|---|---|---|
| Argentina | 20 | 1 | 4 | 20.0 |
| Australia | 18 | 0 | 6 | 33.3 |
| Canada | 23 | 0 | 8 | 34.8 |
| England | 19 | 2 | 9 | 47.4 |
| Fiji | 24 | 1 | 7 | 29.2 |
| France | 11 | 0 | 4 | 36.4 |
| Japan | 8 | 0 | 0 | 0.0 |
| Kenya | 21 | 3 | 5 | 23.8 |
| New Zealand | 22 | 0 | 7 | 31.8 |
| Papua New Guinea | 9 | 0 | 2 | 22.2 |
| South Africa | 28 | 2 | 4 | 14.3 |
| Russia | 11 | 1 | 1 | 9.1 |
| Samoa | 20 | 1 | 7 | 35.0 |
| Scotland | 20 | 1 | 3 | 15.0 |
| USA | 16 | 3 | 3 | 18.8 |
| Wales | 16 | 1 | 3 | 18.8 |
Rucks
| Team | Rucks | Wins | Win % | Opp Rucks | Wins | Win % |
|---|---|---|---|---|---|---|
| Argentina | 74 | 64 | 86.5% | 52 | 8 | 15.4% |
| Australia | 70 | 63 | 90.0% | 68 | 5 | 7.4% |
| Canada | 90 | 79 | 87.8% | 53 | 8 | 15.1% |
| England | 44 | 37 | 84.1% | 48 | 9 | 18.8% |
| Fiji | 44 | 35 | 79.5% | 48 | 8 | 16.7% |
| France | 71 | 62 | 87.3% | 41 | 5 | 12.2% |
| Japan | 52 | 42 | 80.8% | 50 | 5 | 10.0% |
| Kenya | 64 | 58 | 90.6% | 58 | 8 | 13.8% |
| New Zealand | 59 | 52 | 88.1% | 56 | 11 | 19.6% |
| Papua New Guinea | 23 | 19 | 82.6% | 44 | 2 | 4.5% |
| South Africa | 36 | 33 | 91.7% | 91 | 16 | 17.6% |
| Russia | 97 | 84 | 86.6% | 55 | 7 | 12.7% |
| Samoa | 62 | 51 | 82.3% | 54 | 6 | 11.1% |
| Scotland | 55 | 47 | 85.5% | 70 | 10 | 14.3% |
| USA | 31 | 26 | 83.9% | 51 | 10 | 19.6% |
| Wales | 32 | 27 | 84.4% | 53 | 6 | 11.3% |
Breaks
| Team | Breaks | Half Breaks | Opponent Breaks | Opponent Half Breaks |
|---|---|---|---|---|
| Argentina | 12 | 11 | 14 | 8 |
| Australia | 12 | 14 | 21 | 9 |
| Canada | 22 | 12 | 13 | 7 |
| England | 13 | 10 | 13 | 8 |
| Fiji | 18 | 8 | 15 | 7 |
| France | 15 | 5 | 17 | 5 |
| Japan | 9 | 12 | 17 | 8 |
| Kenya | 23 | 11 | 13 | 6 |
| New Zealand | 14 | 10 | 16 | 5 |
| Papua New Guinea | 10 | 4 | 16 | 7 |
| South Africa | 17 | 2 | 10 | 7 |
| Russia | 10 | 10 | 22 | 16 |
| Samoa | 18 | 9 | 13 | 6 |
| Scotland | 23 | 7 | 16 | 10 |
| USA | 14 | 4 | 10 | 15 |
| Wales | 15 | 8 | 16 | 12 |
