Pool A
Australia look to bounce back from a poor Vancouver performance, in part due to untimely turnovers near the try line. Samoa has improved through the year and their handling errors and tackling failures are starting to decrease. But they are still likely destined for the Challenge rounds. England versus Samoa will be a rematch of the feisty Las Vegas game where a season-high 13 penalties were dished out.
| Team |
Pool Win % |
Quarter-Final % |
| England |
81 % |
98 % |
| Australia |
16 % |
76 % |
| Samoa |
2 % |
26 % |
| South Korea |
<1 % |
<1 % |
Pool B
After another loss to England, South Africa looks vulnerable. The Blitzboks, without Speckman, Geduld, Brown, Smith, Senatla, and Dippennar, may not be as dominant as earlier this season but they are still clearly the leaders for this otherwise well-balanced pool. Kenya will be missing Ambaka and Sikuta while France was anticipating a return of Vakatawa before injury ruled him out. Meanwhile the Canadians are without big man Adam Zaruba and Phil Berna. Combined, the teams are fielding five debutants.
| Team |
Pool Win % |
Quarter-Final % |
| South Africa |
98 % |
>99 % |
| Canada |
1 % |
37 % |
| Kenya |
<1 % |
37 % |
| France |
<1 % |
27 % |
Pool C
Fiji versus New Zealand in Hong Kong, you don’t say. The likely pool decider will surely bring the crowd to their feet. NZ and Japan haven’t played since Japan’s upset in Rio, but considering Japan’s current form, it should be a one-sided affair. Wales is fairly bad in the first half, and quite good in the second half so far this season. If they can keep games tight until halftime, they could pull off an upset.
| Team |
Pool Win % |
Quarter-Final % |
| Fiji |
56 % |
93 % |
| New Zealand |
41 % |
90 % |
| Wales |
4 % |
17 % |
| Japan |
<1 % |
<1 % |
Pool D
The USA has edged Argentina in two very exciting quarter-finals in the past two tournaments. The USA holds a strong edge at the kickoff and gaining an extra possession or two could be all the edge they need. Scotland has continued to decline and suffered a loss to Russia in Vancouver. Scotland’s numbers are still bolstered by early-season success but they are slowly becoming a below-average team.
| Team |
Pool Win % |
Quarter-Final % |
| USA |
58 % |
88 % |
| Argentina |
29 % |
70 % |
| Scotland |
12 % |
41 % |
| Russia |
<1 % |
1 % |
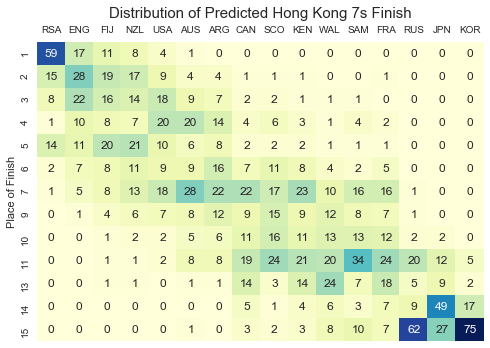
Tournament Finish
I finally finished a full tournament simulator and the distribution for each team’s finish is below. South Africa have a 59% chance of winning the tournament. But you may want to bring that number down considering their injuries.
The simulator considers how the pools crossover which is why the USA is more likely to make the top four than New Zealand even though a head-to-head matchup between the two teams would favor the kiwis. NZ has a greater likelihood of finishing second in their pool, mostly due to Fiji. And if NZ does finish second, they likely meet South Africa in the quarters. The USA avoids South Africa and would likely face Australia in the quarters. A second-place pool finish for the Eagles should pit them against England, a difficult matchup but not as tough as South Africa.