I’ve added some recency to the predictions here, weighting Hong Kong and Singapore results more heavily than other tournaments. But I still lack adjustments for personnel. So a team like England, who played much of Hong Kong and Singapore without captain Tom Mitchell, may be overly hurt by the recency adjustment considering Mitchell is back for Paris.
Pool A
Even considering Canada’s surprise victory in Singapore, they’ll still be heavy underdogs against South Africa who can clinch the series title this weekend. Scotland has leveled off into an average series team but has a good shot at getting back to their first quarter-finals since Wellington.
| Team |
Pool Win % |
Quarter-Final % |
| South Africa |
86 % |
97 % |
| Canada |
11 % |
58 % |
| Scotland |
3 % |
43 % |
| Japan |
< 1 % |
3 % |
Pool B
This pool is loaded and should create some exciting matches. Some of the best USA games this year have come against both New Zealand and Argentina. I’m always on the lookout for NZ missing their first quarter-final ever and there’s a reasonable chance it occurs this weekend. The USA versus New Zealand match has ramifications on the overall series standings where the Eagles could still pass NZ for fourth.
| Team |
Pool Win % |
Quarter-Final % |
| New Zealand |
47 % |
82 % |
| USA |
42 % |
77 % |
| Argentina |
8 % |
28 % |
| Wales |
4 % |
14 % |
Pool C
As mentioned above, England wasn’t up to their best in Hong Kong and Singapore and thus, the numbers are a bit lower than expected. Kenya will look for revenge from that wild Singapore quarter-final. France and Hong Kong qualifier winners Spain are both excellent at restarts, an area of weakness for Kenya. France performed well at their home tournament last year and is 1-0 against England so far this season.
| Team |
Pool Win % |
Quarter-Final % |
| England |
70 % |
92 % |
| Kenya |
20 % |
63 % |
| France |
10 % |
42 % |
| Spain |
< 1 % |
4 % |
Pool D
Over the last two tournaments Fiji has performed the best. They should see competition from Australia and a match with Samoa could get physical, but the Fijians should roll to a favorable quarter-final versus Canada or Scotland. We’ve seen some improvements from Samoa but they struggled in both Hong Kong and Singapore.
| Team |
Pool Win % |
Quarter-Final % |
| Fiji |
82 % |
98 % |
| Australia |
17 % |
82 % |
| Samoa |
1 % |
18 % |
| Russia |
< 1 % |
2 % |
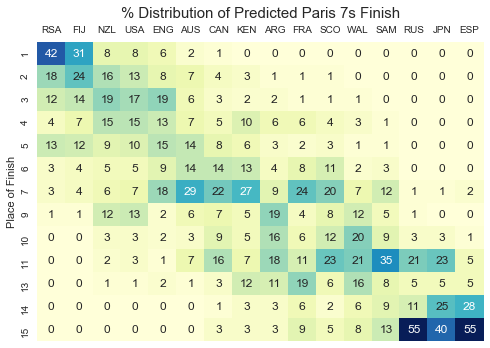
Tournament Finish
Despite the emphasis on recent tournaments, South Africa is still favored, though their advantage over Fiji is narrow. They are both positioned to avoid each other until the final, a match we would all surely enjoy.
Keep in mind that since 7th, 11th, and 15th places don’t have a playoff decider, those rows in the image below total to 200%. These finishes effectively absorb the 100% from finishes 8th, 12th, and 16th that don’t get decided. For example, while Australia’s most likely finish is 7th, after a 5th-place semifinal loss, it’s roughly as likely they win that 5th-place semifinal. After which, their finish is distributed between 5th or 6th places.